This is from our latest bi weekly letter dated May 11, 2009:
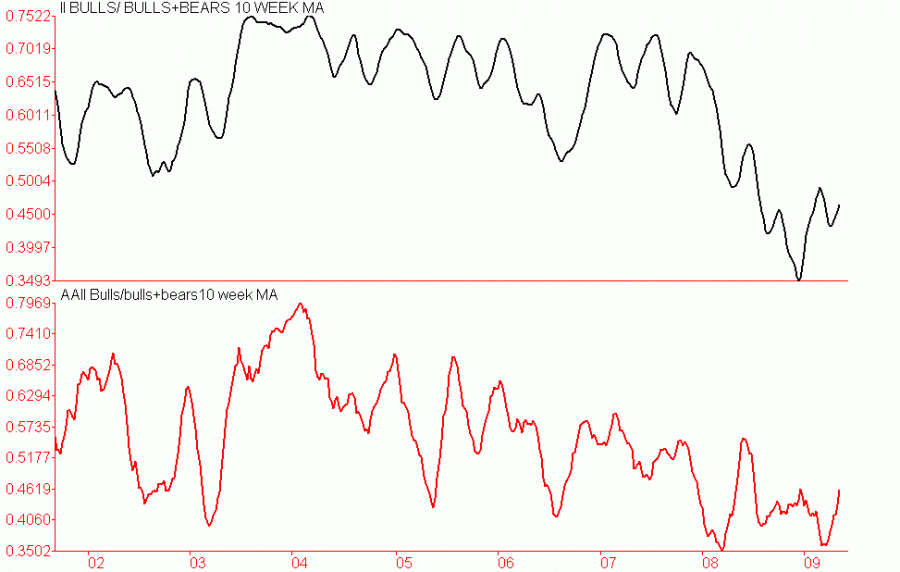
The market has continued to rally in very impressive fashion. It has shrugged off numerous negative divergences and consistent overbought conditions. It handily survived a bearish rising wedge pattern. It has moved decisively above key chart resistance levels and a number of declining trend lines. This has occurred in the face of a mostly negative news environment both economic as well as earnings. There has been some minor shifts in sentiment but with the S&P gaining nearly 40% in a little over two months one would expect to see some shift in sentiment. However, from what we are seeing on a regular basis is that the majority are under invested and under performing. They are hoping (wishing) for a decent correction to get in. Another large group are adding to their short positions awaiting the eminent beginning of the next leg down in the bear market. There are few if any that think that we are in the beginning of a new bull market.
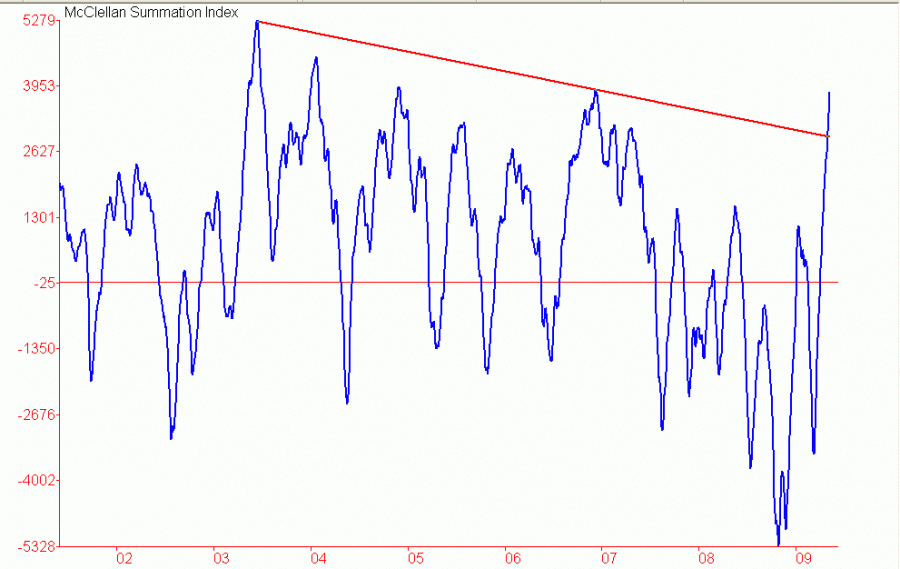
What very few have noticed or made mention of is that the rally continuing in spite of or maybe because of the persistent overbought condition. This in itself is a sign of strength. And when the do correct they get no worse than mid to high neutral which leads to a near immediate resumption of the rally. A market that refuses to get even remotely oversold after such an advance is indeed a strong one and a rare one. This is exactly what we saw following the March 2003 low and following a number of other important long-term bottoms. A good example of the strength that we are talking about can be seen on the chart below of the McClellan summation index. Although it is not yet back to where it was coming off the March 2003 low it has moved up from a much lower position and on an absolute point basis and percent basis it has more than surpassed the move in 2003. Moreover, the peak in 2003 occurred about three months after the price low. We are only a little over two months from the March low which leaves ample time to see the 2003 peak exceeded.

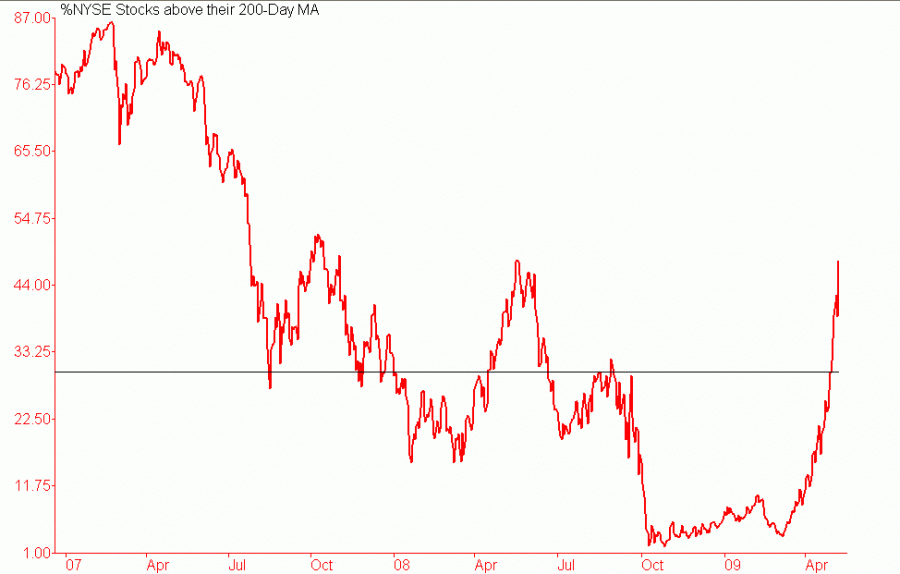
We have also seen a sharp expansion in participation in recent weeks. Individual stocks are breaking out of bases in mass. This is occurring along with a sharp rise in bullish action in a broad array of industry groups and sectors Over the past couple of weeks in the daily reports we have made mention of two important measures of participation. One is the NYSE bullish percent index. This indicator records the percent of NYSE stocks that are on point and figure buy signals. At the March low this indicator was down near 2%, one of the lowest readings in its history, and a level consistent with important market lows. It did actually diverge withy its November low. It is currently above 74%, meaning that 74% of NYSE stocks have broken out basis the point and figure charting method. This certainly does confirm that the rally has seen a sharp expansion in participation. Another of our favorite longer-term measures of participation is the percentage of stocks above their 200-day moving average. Like the bullish percent index this indicator reached extreme low levels in March but did hold above its November low. It gives a buy signal when it moves from below 30% to above. As can be seen on the chart below it does give some false signals such as May 2008. But the majority of the signals historically have been very successful. What we find important and bullish in the current period is the acceleration of the number as the market has rallied. On Friday it moved over nine percentage points from 39% to 48%. This is a very strong one day move and another strong indication that participation is expanding on the rally. This is not what we see at tops but typical of what we see in the early stages of an important breakout. This is far different than what we saw in May 2008 when the daily moves up where one or two points not nine

We have also seen a sharp expansion in participation in recent weeks. Individual stocks are breaking out of bases in mass. This is occurring along with a sharp rise in bullish action in a broad array of industry groups and sectors Over the past couple of weeks in the daily reports we have made mention of two important measures of participation. One is the NYSE bullish percent index. This indicator records the percent of NYSE stocks that are on point and figure buy signals. At the March low this indicator was down near 2%, one of the lowest readings in its history, and a level consistent with important market lows. It did actually diverge withy its November low. It is currently above 74%, meaning that 74% of NYSE stocks have broken out basis the point and figure charting method. This certainly does confirm that the rally has seen a sharp expansion in participation. Another of our favorite longer-term measures of participation is the percentage of stocks above their 200-day moving average. Like the bullish percent index this indicator reached extreme low levels in March but did hold above its November low. It gives a buy signal when it moves from below 30% to above. As can be seen on the chart below it does give some false signals such as May 2008. But the majority of the signals historically have been very successful. What we find important and bullish in the current period is the acceleration of the number as the market has rallied. On Friday it moved over nine percentage points from 39% to 48%. This is a very strong one day move and another strong indication that participation is expanding on the rally. This is not what we see at tops but typical of what we see in the early stages of an important breakout. This is far different than what we saw in May 2008 when the daily moves up where one or two points not nine

One of the most frequent questions we hear is "When will this rally end?" Our simple answer is that it will end when the majority accept and embrace the rally. Instead of asking when will it end the buzz word will be "we need to buy the dips. Right now the majority are selling the rally. This does not mean that we can not have a correction over he very near-term. However, at this point in the cycle we expect corrections to be shallow in both points and time with any surprises to continue to be on the upside. Short-term we are officially going to remain neutral but with a positive bias. Medium and long-term we are bullish.
Click on the link below to take you to our web site where you can sign up for a free two week trial
www.marketsummaryandforecast.com


