OK, sure, the momentum is still down and so is Selecto's indicator too. Plus we have an options oscillator Sell.
But look at this chart:
http://stockcharts.com/c-sc/sc?s=$SPX&p=D&b=5&g=0&i=p85171602053&a=74576416&r=7615.png
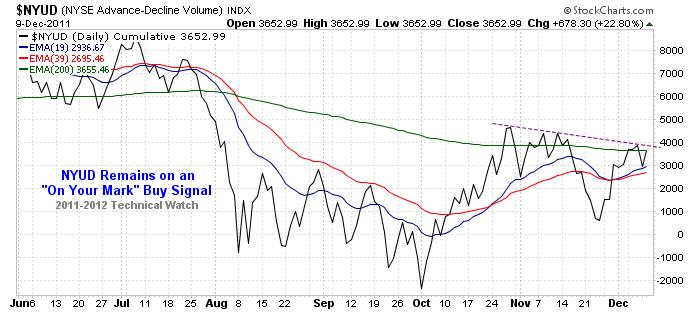
We're already above the 200-day ema. The 21 and 50 are beneath and close together which is usually good support. The 200-day ema is up-trending and that's a sign for many of an ended Bear Market. Worse, the cumulative A/D volume is quite positive here. Christmas is coming, too. Now, what happens if we break out of this pattern? That's right. The 200-day SMA goes. That's what happens. How many Bears will cover when that happens? How many times will we threaten to break out of this pattern but fail to do so?
Now, just think on it. What would cause the largest number of people the most consternation while benefiting the largest amount of money?
Draw your own conclusions.
Mark

Don't Like It
Started by
OEXCHAOS
, Dec 10 2011 11:35 AM
25 replies to this topic
#1

OEXCHAOS
-
- Admin
- 22,339 posts
Mark S. Young
Posted 10 December 2011 - 11:35 AM
Mark S Young
Wall Street Sentiment
Get a free trial here:
http://wallstreetsen...t.com/trial.htm
You can now follow me on X
#2
senorBS
-

- TT Member+
- 11,133 posts
Member
Posted 10 December 2011 - 11:53 AM
OK, sure, the momentum is still down and so is Selecto's indicator too. Plus we have an options oscillator Sell.
But look at this chart:
http://stockcharts.com/c-sc/sc?s=$SPX&p=D&b=5&g=0&i=p85171602053&a=74576416&r=7615.png
We're already above the 200-day ema. The 21 and 50 are beneath and close together which is usually good support. The 200-day ema is up-trending and that's a sign for many of an ended Bear Market. Worse, the cumulative A/D volume is quite positive here. Christmas is coming, too. Now, what happens if we break out of this pattern? That's right. The 200-day SMA goes. That's what happens. How many Bears will cover when that happens? How many times will we threaten to break out of this pattern but fail to do so?
Now, just think on it. What would cause the largest number of people the most consternation while benefiting the largest amount of money?
Draw your own conclusions.
Mark
si as in uno-dos and uno-dos and then tres of tres norte. now who really believes that could happen? IMO almost no except which is why old codger Senor thinks it just may happen
BSing away
Senor
#3
Rogerdodger
-

- TT Member*
-

- 26,975 posts
Member
Posted 10 December 2011 - 12:00 PM
"I'm looking at that downtrend line, knowing that "they" are too."
(I covered that short Thursday.)
(I covered that short Thursday.)
Tactically, it makes zero sense to let it go at this stage, just one more BS news and one more pump to go to finish the year. Feels and looks like 2007 even with the last minute Nov rally...
I'm looking at that downtrend line, knowing that "they" are too.
But it was too tempting to not short with the low trin warning at such resistance.
This "should" be dead here.
But I don't trust 'em.
http://stockcharts.com/c-sc/sc?s=$VIX&p=D&yr=0&mn=11&dy=0&i=p24254219869&a=179964330&r=4659.png
Edited by Rogerdodger, 10 December 2011 - 12:03 PM.
"Nature's Failure to Function in a 'Predictable Way'... 500 years ago?"
BIGGEST SCIENCE SCANDAL EVER...Official records systematically 'adjusted'.
BIGGEST SCIENCE SCANDAL EVER...Official records systematically 'adjusted'.
#4
DrSP
-

- Traders-Talk User
- 2,391 posts
Member
Posted 10 December 2011 - 12:02 PM
Mark, Agreed with the swing term that it is dodgy. Very short term, I got a buy signal yesterday but that may go down on Monday, will be stopped out if it gaps down.
You could be a billionaire or an industrial worker or a teacher or a moderator of a forum - Hold a good conscience because that is what matters.
#5
SemiBizz
-

- Traders-Talk User
- 23,215 posts
Volume Dynamics Specialist
Posted 10 December 2011 - 12:07 PM
So far it looks to me like the Annual holiday Bearish Upthrust is in play. This chart is from after Thursday's close, but we did see a spring higher on the back of a lighter volume test on Thursday, consistent with a broadening top megaphone sideways at the top move. This rally was built on top of 130 pts of hot air gap up on the Nasdaq, so that is suspect. Based on what I see in the Euro, crude, the SOX, and the XOI, I still think that bearish upthrust can persist.
However, we have the support all mapped out here in case it fails...
Price and Volume Forensics Specialist
Richard Wyckoff - "Whenever you find hope or fear warping judgment, close out your position"
Volume is the only vote that matters... the ultimate sentiment poll.
http://twitter.com/VolumeDynamics http://parler.com/Volumedynamics
Richard Wyckoff - "Whenever you find hope or fear warping judgment, close out your position"
Volume is the only vote that matters... the ultimate sentiment poll.
http://twitter.com/VolumeDynamics http://parler.com/Volumedynamics
#6
fib_1618
-

- Traders-Talk User
- 10,210 posts
Member
Posted 10 December 2011 - 12:16 PM
Careful.Worse, the cumulative A/D volume is quite positive here
Fib
Better to ignore me than abhor me.
“Wise men don't need advice. Fools won't take it” - Benjamin Franklin
"Beware of false knowledge; it is more dangerous than ignorance" - George Bernard Shaw
Demagogue: A leader who makes use of popular prejudices, false claims and promises in order to gain power.
#7
Rogerdodger
-
- TT Member*
-
- 26,975 posts
Member
Posted 10 December 2011 - 12:28 PM
Laundry has been pushing a mid January "ringing cycle" low.
One possibility is a 2004/2005 repeat where price holds to year's end.
Just my thinking out loud BS at this point.
http://stockcharts.com/c-sc/sc?s=$VIX&p=D&st=2004-12-01&en=2005-02-01&i=p18700805739&a=72107875&r=9845.png
http://stockcharts.com/c-sc/sc?s=$SPX&p=D&yr=0&mn=9&dy=0&i=p86417550408&a=234727006&r=522.png
Edited by Rogerdodger, 10 December 2011 - 12:30 PM.
"Nature's Failure to Function in a 'Predictable Way'... 500 years ago?"
BIGGEST SCIENCE SCANDAL EVER...Official records systematically 'adjusted'.
BIGGEST SCIENCE SCANDAL EVER...Official records systematically 'adjusted'.
#8
selecto
-

- Traders-Talk User
- 6,871 posts
Member
Posted 10 December 2011 - 12:51 PM
Posting this, but I know nothing, nothing...


FIB, I assume you (and other internals people) are happy with NYA stats
to divine the SPX. I ask, because half the issues on the NYSE are fixed
income plays. I note some interesting discrepancies also. For instance
BPSPX mo gives me a "sell" Friday (and was down), while BPNYA is merrily
trucking along (and was up).
Edited by selecto, 10 December 2011 - 12:55 PM.
#9
nimblebear
-

- Traders-Talk User
- 6,062 posts
Welcome to the Dark Side !
Posted 10 December 2011 - 01:06 PM
Last time I was this pissed at the market on a Friday, it exploded higher for more than a week.
So I'm long and strong via some 3x etf's, just to prove I can humble myself, and make some good money on the long side for a bit.
Might as well as ride the $27 trillion in liquidity that has benefited only the 1%, and been pilfered from the futures of the 99%, their children, and their children's children. 
OTIS.
#10
andr99
-

- Traders-Talk User
- 7,899 posts
Member
Posted 10 December 2011 - 01:17 PM
OK, sure, the momentum is still down and so is Selecto's indicator too. Plus we have an options oscillator Sell.
But look at this chart:
http://stockcharts.com/c-sc/sc?s=$SPX&p=D&b=5&g=0&i=p85171602053&a=74576416&r=7615.png
We're already above the 200-day ema. The 21 and 50 are beneath and close together which is usually good support. The 200-day ema is up-trending and that's a sign for many of an ended Bear Market. Worse, the cumulative A/D volume is quite positive here. Christmas is coming, too. Now, what happens if we break out of this pattern? That's right. The 200-day SMA goes. That's what happens. How many Bears will cover when that happens? How many times will we threaten to break out of this pattern but fail to do so?
Now, just think on it. What would cause the largest number of people the most consternation while benefiting the largest amount of money?
Draw your own conclusions.
Mark
If I look at your blue and green curves (21 and 50 days mas) going back to July 18th I see the same that I' m expecting here, down to 1220.......bounce on the intersection of the two curves.......... up to 1255 and then.............plunge
forever and only a V-E-N-E-T-K-E-N - langbard


