S&P 500 CASH
SPX CASH: DailyProjected Support and Resistance levels: High - 1224; Low - 1217
SEPT SP:
SPX CASH:
SEPT SP:
SPX CASH:
SPX CASH:
Current SPX Index Positions:
Mid-term (6-8 weeks) = FLAT
Short-term (1 day-3 weeks) = 70% LONG @1223.41 (intraday today)
From previous outlook: "For the new week, in a more bullishtrend the probabilities tend to favor an early-week low into support, to be followed by alate-week test of resistance. For that support we have the new weekly projected supportlow of 1220 SPX CASH, which is also near the prior upside breakout point (1219). In otherwords, if this level is tested on an early-week low, then look for prices to firm up at orwithin a point or two of this level, and with the same 1219 area now acting as short-termclosing support to any move lower. If the above is tested on an early-week decline, thenagain the odds will quickly shift in favor of a rally into mid-to-late week, with the 1240weekly projected resistance high acting as the upside magnet to price. Note as well thatthis same 1240 level is also near outlined ‘make or break’ resistance, which isnow in a range between the 1240-1252 area on this index."

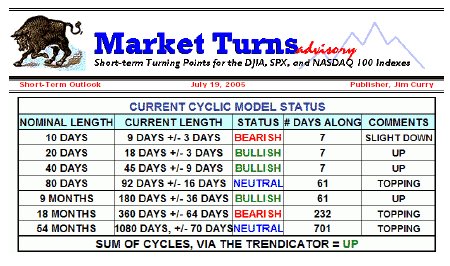
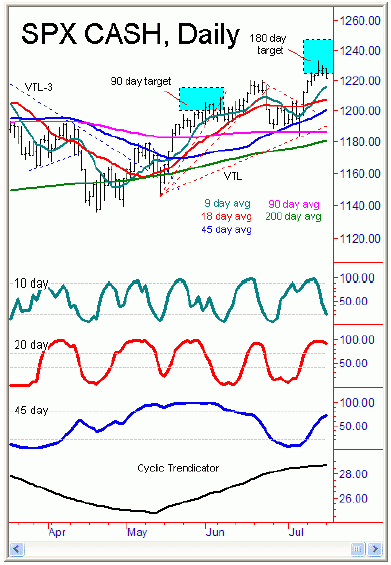
Current analysis: The SPX saw some correction south in today’ssession, hitting an intraday low of 1121.13 SPX CASH - and also closing near the lows forthe same, which looks to invite at least some marginal weakness at some point inTuesday’s session. Volume here was light, coming in at only 1.2 billion shares, whichis an 8% contraction from Friday’s numbers and still indicates that the move off the1233.16 swing top from last week is a simple consolidation pattern that should be followedby higher highs upon completion. As per the notes from last night, the basic call was foran early-week selloff into support (1219-1220 SPX CASH), which so far we are seeing. Ifthe pattern is correct, then the probabilities will favor a bottom at or near outlinedsupport (give or take a couple of points), and then will be followed by renewed buying fora test or ideally a move back above the 1233.16 area in the coming days, as thestatistical analysis from the 45 day cycle still indicates should be out there. The only‘thorn’ that I see here is that the SPX could work a bit lower than noted weeklyprojected support, as the 9 day moving average on the daily chart could now be acting as amagnet to price if the 10 day cycle has topped and has turned down - which is at leastspeculation on my part for now.
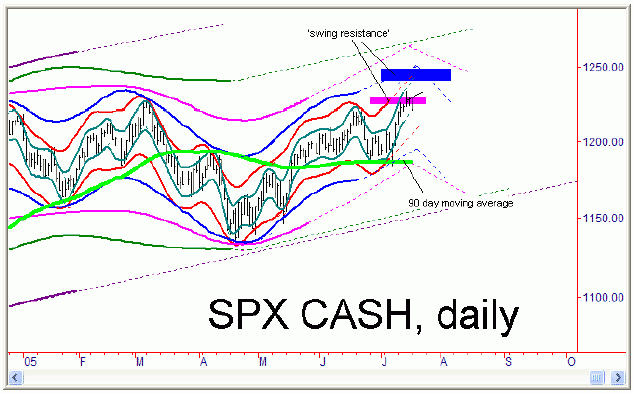
As well, if a correction lower of another day or two is seen - and pricesmanage to make a try at the 9 day moving average on the daily chart and then go back upand make new swing highs for the move (on the next 10 day up cycle phase), then we may beable at that point to steepen our VTL uptrend line for this index. Right now I am notsure; it depends actually on how the action from price plays out in the next day or threehere. For now, look for a low at or within a few points of the weekly projected supportzone - with the possibility of a dip to the 9 day moving average - then to be followed byat least one move to new highs in the next few days/week-or-two, and at that time we willwant to reassess the technical action here to see if a larger 45/90 day cycle top isforming. As well, once that larger peak is in place, the expectation will switch to thatof the 90 day moving average (chart above in bright green) being the downside attractor toprice - with current resistance to this 45/90 day up cycle again noted at the 1240-1252‘make or break’ area.

NASDAQ 100 CASH
Daily Projected Support and Resistance levels: High -
5-Day Projected Support and Resistancelevels: High - 1603; Low - 1556
Monthly Projected Support and Resistance levels: High - 1531; Low - 1461
Current NDX Index Positions:
Mid-Term (6-8 weeks) = FLAT
Short-term (1 day - 3 weeks) = FLAT
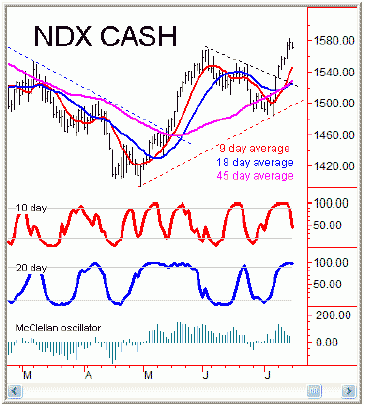
From previous outlook: "the recent time notes here havesuggested that a larger peak with the 45/90 day cycles will not be seen until on or after7/19/05 - and with this we have to look for at least marginally new highs in the comingdays. With the above then said and noted, the ideal pattern that we will see for the newweek will be that of some selling into Monday or Tuesday’s session, with the 1556weekly projected support low (+/- 6 points) acting as a possible downside magnet to price.If tested and it holds the downside action on a closing basis, then the expectation is forthe index to firm back up into late-week for a try at the 1589-1602 ‘make orbreak’ zone as outlined from above."

Current analysis: As with the SPX, so far the NDX has seen theearlyweek decline pattern that was noted last night, though this index is still holdingwell above it’s own weekly projected support area of 1550-1562 (I.e., 1556, +/- 6points). Volume on today’s drop was extremely light, coming in at less than 1.3billion shares on this index, which is a 13% contraction from Friday’s figures and ismore short-term neutral than anything here as no higher swing high or lower swing low onthe daily chart has been registered. As per the notes from last, the odds did favor theearly-week decline into support pattern. The early-week decline we are seeing, so itshould be interesting to see if prices can move just a bit lower here in the next day orso for a test of outlined support from above. As well, if support is tested and holds thedownside here, then the expectation is for prices to firm back up later in the week orearly next week for a try at higher resistance at the 1589-1602 region. As per the noteswith time, the probabilities are low for any important peak to be seen on or before7/19/05, and with that we have to look for at least one - and possibly several - new swinghighs in the coming week or so, even though a larger peak is expected to be in the processof forming with the 45 and 90 day cycles. Stay tuned.
Jim Curry
Market Turns Advisory
Email: jcurry@cycle -wave.com


