
The Bottom is in??
Started by
kssmibotm
, Aug 21 2008 06:03 AM
16 replies to this topic
#1

kssmibotm
-
- Traders-Talk User
- 653 posts
Member
Posted 21 August 2008 - 06:03 AM
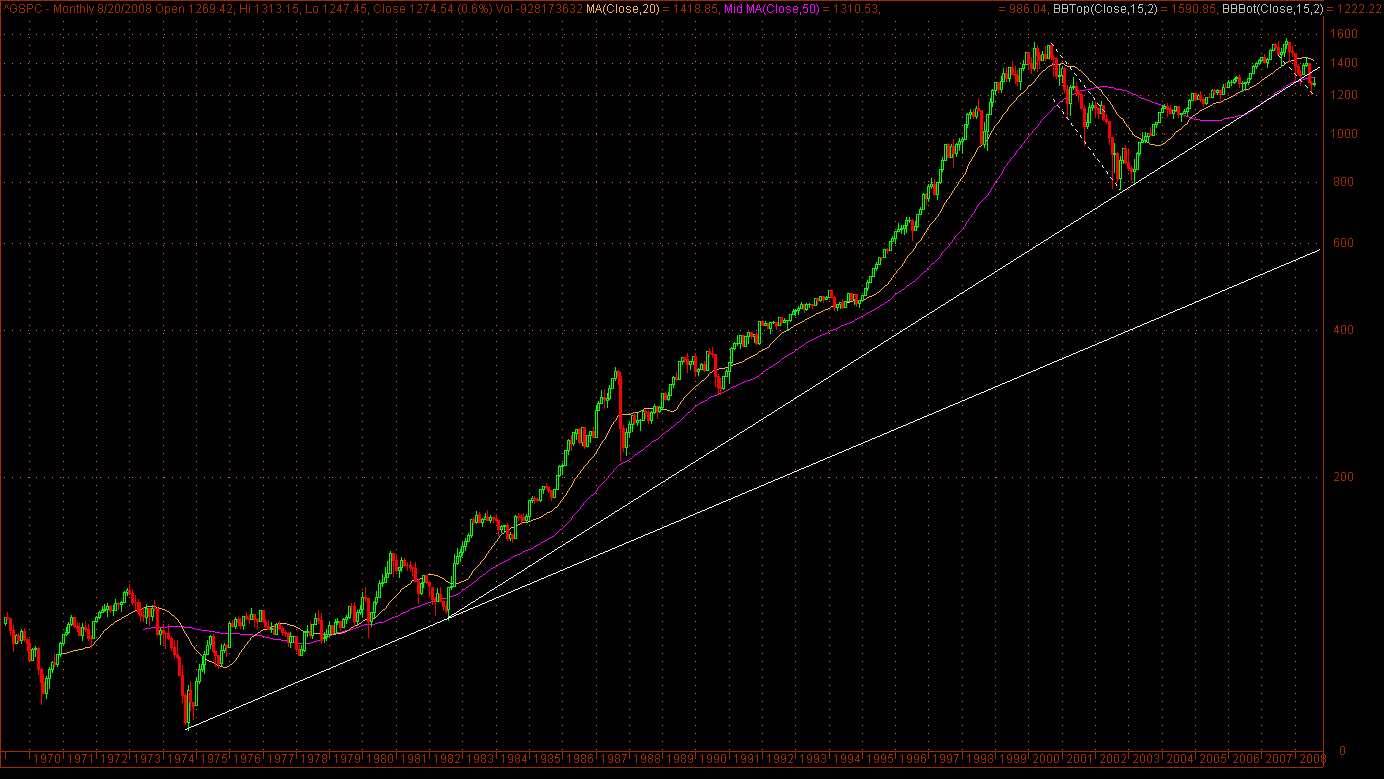
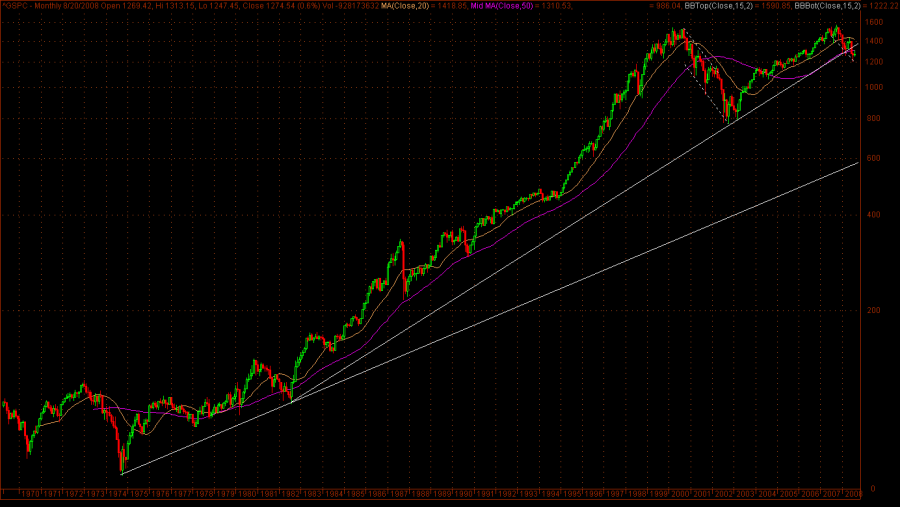
Sorry UFO, but I find your trendline placement to be somewhat arbitrary and strategically placed to prove your point. Why not extend the trendline to the August 1982 low -- widely considered to be the start of this bull market? The long term trendline shown in the chart below tells quite a different story. SPX has already broken below the trendline and struggling to rise above it.
People think the Holy Grail is something looked for but never found. In fact, it is something often found but rarely recognized.
#2
eminimee
-

- TT Member
- 14,307 posts
I don't care who's fur is flying...
Posted 21 August 2008 - 06:50 AM
I tend to agree...I posted the same thing in one of UFO's earlier threads from last week mentioning it's the old rising tops line from 87 through 94 that interests me the most. Here's both log and linear fwiw.
LOG:
http://stockcharts.com/c-sc/sc?s=$SPX&p=M&st=1980-01-01&i=p00449385827&a=90720826&r=1558.png
LINEAR:
http://stockcharts.com/c-sc/sc?s=$SPX&p=M&st=1980-01-01&i=p06480362215&a=119373031&r=2870.png
LOG:
http://stockcharts.com/c-sc/sc?s=$SPX&p=M&st=1980-01-01&i=p00449385827&a=90720826&r=1558.png
LINEAR:
http://stockcharts.com/c-sc/sc?s=$SPX&p=M&st=1980-01-01&i=p06480362215&a=119373031&r=2870.png
#3
LarryT
-

- Traders-Talk User
- 1,066 posts
Member
Posted 21 August 2008 - 07:18 AM
Sorry UFO, but I find your trendline placement to be somewhat arbitrary and strategically placed to prove your point. Why not extend the trendline to the August 1982 low -- widely considered to be the start of this bull market? The long term trendline shown in the chart below tells quite a different story. SPX has already broken below the trendline and struggling to rise above it.
The 1974 to 1982 TL is the one in play. Been saying the Super Cycle top is in for over a year year now and that 74-82 TL is the first support around 2010.
LT
#4
U.F.O.
-

- TT Patron+
- 5,605 posts
U.F.O.
Posted 21 August 2008 - 07:23 AM
"Why not extend the trendline to the August 1982 low -- widely considered to be the start of this bull market?"
Because my MetaStock E-Signal feed only has data going back to 1985, as I'm mentioned several times here. "To prove my point"? Do you make a habit of jumping to wrong conclusions?
U.F.O.
Edited by U.F.O., 21 August 2008 - 07:28 AM.
"Democracy is two wolves and a lamb voting on what to have for lunch. Liberty is a well-armed lamb contesting the vote!"
~Benjamin Franklin~
~Benjamin Franklin~
#5
mss
-

- TT Sponsor
- 6,182 posts
I'M WATCHING
Posted 21 August 2008 - 07:32 AM

I cannot say that THE TOP or THE BOTTOM is in or out. What I can say is that the WEEKLY TREND is down until the upper channel BLUE line is broken to the upside.
http://stockcharts.com/c-sc/sc?s=$SPX&p=W&yr=10&mn=6&dy=0&i=p61331230210&a=136421765&r=160.png
While we are drawing TREND lines of sup. & rest. I really like the next two. I think Mr. "T" has posted the "fork" before.


mss
144
Edited by mss, 21 August 2008 - 07:34 AM.
WOMEN & CATS WILL DO AS THEY PLEASE, AND MEN & DOGS SHOULD GET USED TO THE IDEA.
A DOG ALWAYS OFFERS UNCONDITIONAL LOVE. CATS HAVE TO THINK ABOUT IT!!
A DOG ALWAYS OFFERS UNCONDITIONAL LOVE. CATS HAVE TO THINK ABOUT IT!!
#6
LarryT
-
- Traders-Talk User
- 1,066 posts
Member
Posted 21 August 2008 - 07:32 AM
The 1974 to 1982 TL is the one in play. Been saying the Super Cycle top is in for over a year year now and that 74-82 TL is the first support around 2010.
LT
[/quote]
 Chart with cycles and wave counts.
 Chart with cycles and wave counts.
#7
eminimee
-
- TT Member
- 14,307 posts
I don't care who's fur is flying...
Posted 21 August 2008 - 07:37 AM
MSS....this is the more recent fork I'm watching....sorry for all the indicators on here...but they are all relevant..
http://stockcharts.com/c-sc/sc?s=$SPX&p=W&yr=7&mn=6&dy=0&i=p55869806190&a=57601821&r=4967.png
http://stockcharts.com/c-sc/sc?s=$SPX&p=W&yr=7&mn=6&dy=0&i=p55869806190&a=57601821&r=4967.png
#8
Jnavin
-

- TT Member*
-

- 2,126 posts
Member
Posted 21 August 2008 - 08:22 AM
"Kssmibotm" is certainly an unusual name...
#9
SemiBizz
-

- Traders-Talk User
- 23,215 posts
Volume Dynamics Specialist
Posted 21 August 2008 - 08:59 AM

Try rubbing your bottom with some of this... it's bacon scented !!
Seriously, no volume today... they can print any price they want.
Price and Volume Forensics Specialist
Richard Wyckoff - "Whenever you find hope or fear warping judgment, close out your position"
Volume is the only vote that matters... the ultimate sentiment poll.
http://twitter.com/VolumeDynamics http://parler.com/Volumedynamics
Richard Wyckoff - "Whenever you find hope or fear warping judgment, close out your position"
Volume is the only vote that matters... the ultimate sentiment poll.
http://twitter.com/VolumeDynamics http://parler.com/Volumedynamics
#10
linrom1
-

- Traders-Talk User
- 4,651 posts
Member
Posted 21 August 2008 - 09:21 AM
Those are some great looking charts. However, I don't see how a trend line connecting only two price points spanning decades proves anything. Personally I think that trend lines are only useful because they show shifting momentum and general direction of price in very short periods.
Price channels are not the same as trend lines or Andrew's forks.
Edited by linrom1, 21 August 2008 - 09:24 AM.


