One of the things we have discussed in depth over the past few weeks was to expect not one or two tests of the October 10 low but a series of tests. This view was based primarily on the fact that on October 10 a number of key momentum indicators were not only deeply oversold but had reached oversold levels not seen since 1987 and as far back as 1974. In fact, a number of indicators, mostly internal measures hit record oversold levels. This was not your normal deeply oversold condition but one that indeed pointed to the need for multiple tests and perhaps more than one lower low in price. Here we are over a month down the road and we have seen two tests and a marginal new low on the S&P. The latter was not confirmed by the DJIA as it held above its October 10 low. This does constitute a potential divergence but one that is far from being confirmed.
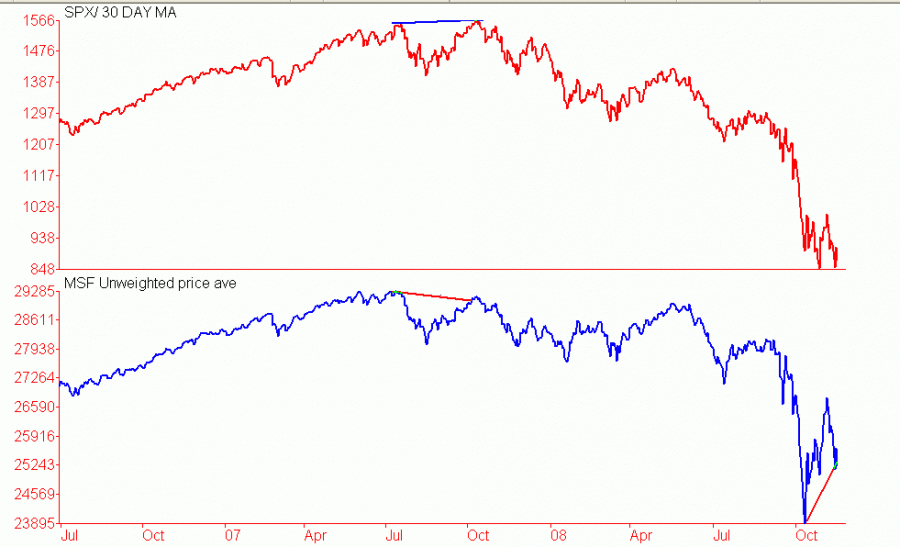
The series of tests and last weeks marginal new low was not confirmed by nearly all of our indicators both internal such as the new lows as well as others. The latter includes such measures as the McClellan oscillator, our own breadth and volume oscillators as well as RSI both on a daily and weekly basis. This is all consistent with the fact that peak participation and momentum for the post 2007 decline was no doubt seen on October 10. Another indicator that is painting the same picture is the NYSE bullish percent index. This measures the percentage of NYSE stocks that are on point and figure buy signals. On October 10 this indicator dropped to 2%. As was pointed out to us then by a friend was that this indicator had only been that low on three previous occasions dating back to 1953. One was in 1953 right at the beginning of primary wave 3 of cycle wave I. The other two times was in 1974 and 1987. Last week, in spite of the lower low in the S&P and NYSE Composite the bullish percent dropped to 26%. This is a huge dislocation from the 2% level seen in October. We are seeing similar behavior from the new lows. We also have a massive divergence developing with our Market Summary and Forecast un-weighted price average. This measures the performance of the average NYSE stock on an un-weighted basis. As can be seen on the chart below the un-weighted average held significantly above its October 10 lows both in late October and again last week. This is another indication that the average stock is holding up far better than the averages from early October, which is also consistent with the late stages of a decline.

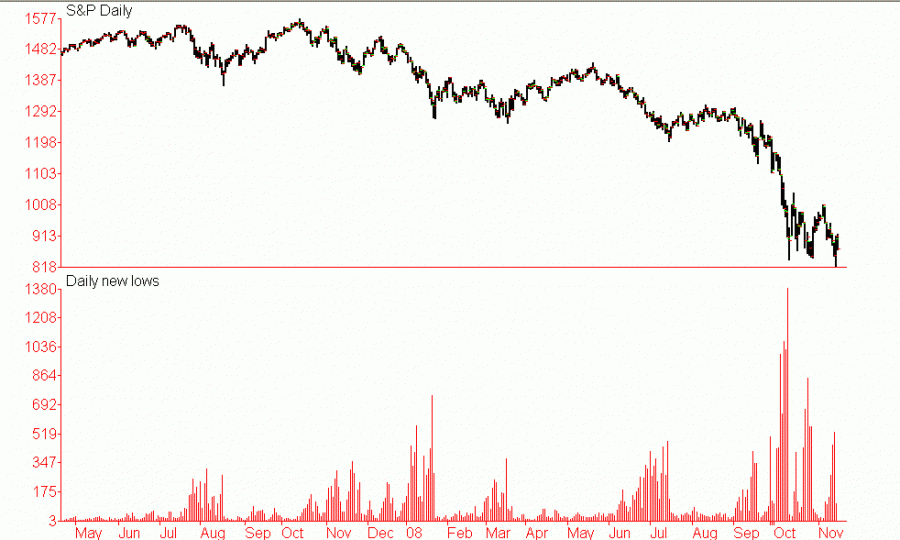
We also want to point out that divergences between the S&P and the un-weighted price average is rare, especially after a decline. We do want to point out the small divergence at the peak last October and also how wide the divergence is currently. We also want to emphasize that with all divergence analysis that until the divergence is confirmed as real that they (divergences ) should be treated as potential divergences only. This does not mean that they are of now value at this time. To the contrary, what we are seeing is consistent with our Elliott wave outlook that the major averages are indeed entering the final phase of the decline. What it does tell us is, on a short-term basis we should not act on potential divergences in an of themselves. As we discussed earlier, the new lows have also been diverging. The chart below shows the big dig divergence last week with the October 10 total. Also notice that the number of new lows last week were also below the level seen in late January.

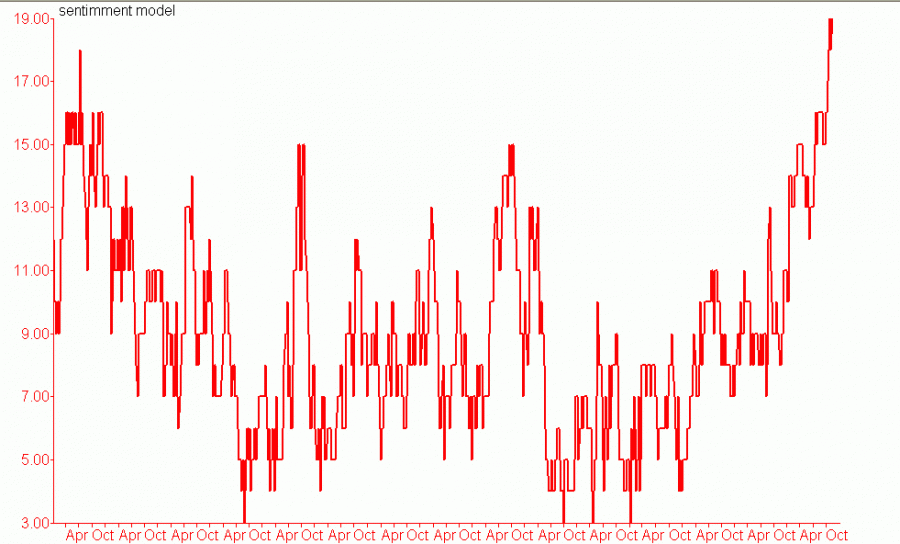
Our Market Summary and Forecast technical barometer has given a series of bullish signals over the past several weeks with last weeks reading the most bullish in its over fourteen year history. We do need to mention he fact that the barometer was designed not as a precise timing tool but as a forward looking indicator of perhaps several weeks. There have been times in fact when the markets response to a signal, either bullish or bearish would occur up to two to three months from the initial signal. the initial bullish signal came, not surprisingly, the week of October 10. The persistent bullish signals since then argue that although we may snot be there yet we are nonetheless close. This is the same message we are receiving from our sentiment model whish is also at record levels

The wave structure and the technical backdrop are telling the same story. And that story is that the market is in the last phase of the post 2007 bear market. We expect that the decline is not over and that lower lows are likely in the days ahead but that any further weakness from current levels will serve to further strengthen the bullish medium and long-term technical backdrop setting the stage for a significant advance next year. Short-term we are going to remain neutral. Medium and long-term we are bullish.
www.marketsummaryandforecast.com


