SPX - NEW BULL?
#1
Posted 13 November 2009 - 01:18 PM
Look at it full size to see the power now in place. Real or otherwise.
http://stockcharts.com/c-sc/sc?s=$SPX&p=D&yr=10&mn=6&dy=0&i=p96421644619&a=182489919&r=9.png
Regardless of any short or intermediate term thinking the SPX has moved solidly into a "BULL Market."
The (89,233,1) MACD has crossed above the (55,89,1) MACD for the first time sense late Aug.2003.
To answer the next question, "can it crash-yes" not likely with current known factors.
JMHO, comments welcome.
mss
A DOG ALWAYS OFFERS UNCONDITIONAL LOVE. CATS HAVE TO THINK ABOUT IT!!
#2
Posted 13 November 2009 - 01:40 PM
"If you've heard this story before, don't stop me because I'd like to hear it again," Groucho Marx (on market history?).
“I've learned in options trading simple is best and the obvious is often the most elusive to recognize.”
"The god of trading rewards persistence, experience and discipline, and absolutely nothing else."
#3
Posted 13 November 2009 - 02:02 PM
#4
Posted 13 November 2009 - 03:20 PM
#5
Posted 23 November 2009 - 08:11 AM
#6
Posted 25 November 2009 - 12:21 AM
The series of 1,2's is still viable. Unlikely, but there it is.
What's 1-2 1-2, a stuttering market?
When you have corrections, the wave counts get pretty ugly, the move since March as sharp as it is has all the markings of a series of corrective waves.
For a glimpse of the near future, just take a look at the Japanese market....or the upcomig reversal in Gold and the buck... I am getting ahead of myself here but the Japanese moves are already recent history.
GS.
#7
Posted 01 December 2009 - 01:59 PM
The series of 1,2's is still viable. Unlikely, but there it is.
What's 1-2 1-2, a stuttering market?
When you have corrections, the wave counts get pretty ugly, the move since March as sharp as it is has all the markings of a series of corrective waves.
For a glimpse of the near future, just take a look at the Japanese market....or the upcomig reversal in Gold and the buck... I am getting ahead of myself here but the Japanese moves are already recent history.
GS.
We are just seeing the charts differently. I see a possible exposion higher and I want to be in on it if it happens. I am willing to risk gains that I have in order to catch this exposion.
Cycles lows are in or very close. The $NIKK looks like it hit its low. I have been very long numerous ways for a long time. Why get out? Market has never chased one out.
Again, we just see the charts differently.
#8
Posted 04 December 2009 - 08:41 PM
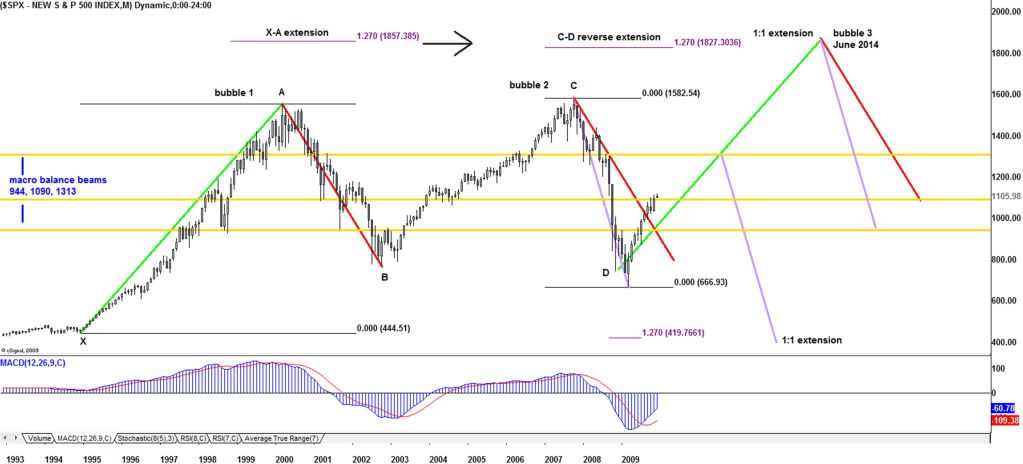
note the balance beam values to left and how they play a key roll in price structure
[img]http://i116.photobucket.com/albums/o12/lambro3/2009/spxbubble1209.jpg[/img
http://www.youtube.c...radingAuthority
http://www.thetradingauthority.com
#9
Posted 05 December 2009 - 11:02 AM
http://www.youtube.c...radingAuthority
http://www.thetradingauthority.com
#10
Posted 19 December 2009 - 09:49 AM
Well it is truth test time.
http://stockcharts.com/c-sc/sc?s=$NYA&p=D&yr=1&mn=0&dy=0&i=p34852065091&a=172718480&r=589.png
A DOG ALWAYS OFFERS UNCONDITIONAL LOVE. CATS HAVE TO THINK ABOUT IT!!