Equinox, is such a time.
But in order to confuse or mislead, the repetition often turn things upside down, so you won't notice. A bottom becomes a top, vice verca and so on.
In my Sptember 22 post I started out with this sentence.
"What you didn't see, understand or perhaps ignored" was the title of the post.
I wrote
What most people have focused on - and still do, is the break, by SPX and DOW, of the 2002 low.
many are still expecting a re-test.
What they ignore, is the fact that almost all other indexes , worldwide did not break.
Now - if you substitute Worldwide, with US indexes, we have the exact same situation at winter Equinox (Dec 21) as we had at Fall equinox (September 22nd), just the opposite. People focus on SPX and DOW, which had NOT broken out on the 21st, while "all" others had - actually the break out came ON Equinox.
Hence the majority failed to se/understand this year's second most importan event (the first one was the March 9 Low - 10 days away from spring Equinox)
And when was the 2000 high in NDX?
March 24th - 3 days away from the 2000 spring Equinox....
What also has spooked people, is the speedey recovery from that bottom + the 50% retracement level of the 2007-2009 Bearmarket (of SPX).
The reason for the speede recovery was explained in that post (the MEGA downside break failure of SPX,DOW and CMPQ).
http://www.traders-t...?...&hl=STICKAN
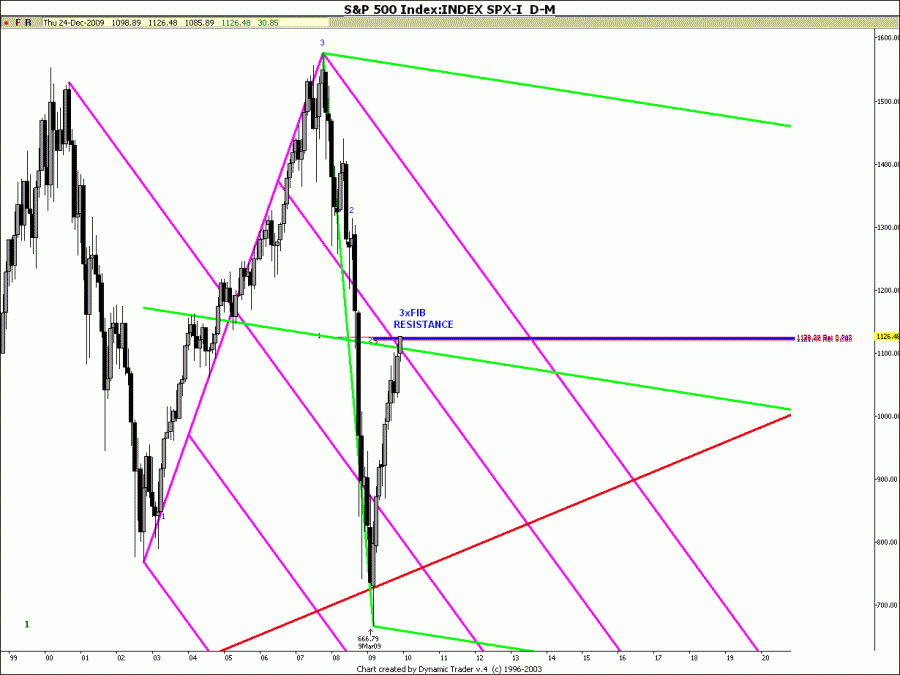
And a Monthly chart looks like this.
Thusday we barely broke the 50% level, but the cross of the Double Pitchfork was actually broken before.
So what now?
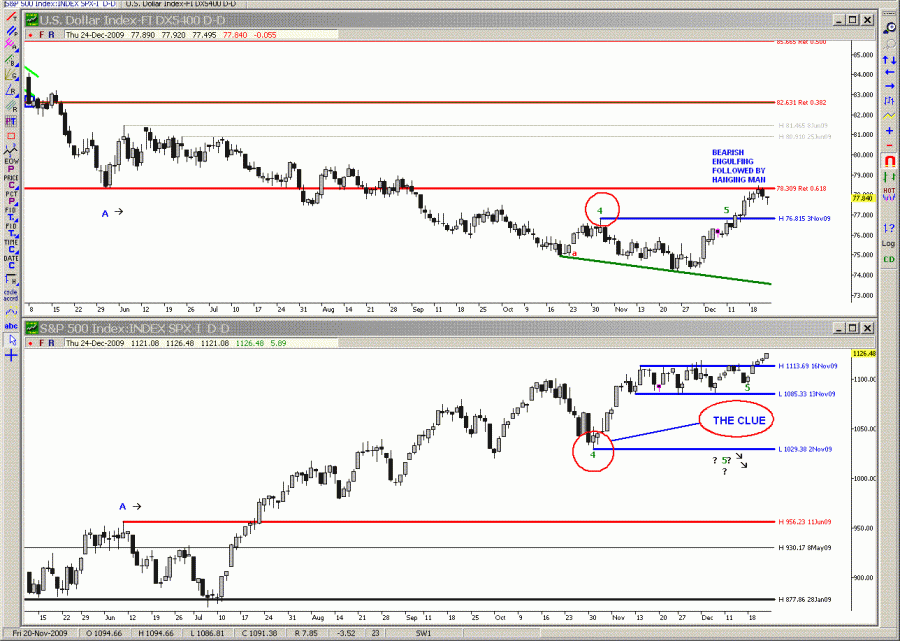
Let's look at the connection bettween the Dollar and SPX - they had for a loong time been connection inversly. Falling dollar resulted in rising SPX. Then suddenly something happened in the beginning of december. The relation ship stopped working - it was when the dollar started it's correction against the downtrend. A rising dollar failed to make SPX go lower. That.s when we got the first, "the dog didn't bark" clue (Solution to a Sherlock Holmes Mystery). When something that is supposed to happen, doesn't happen - watch out!
If you look at the chart below, when the dollar reached "5" in the upper chart SPX was nowhere near "5" in the lower chart and never reacted to the upside break.
The stock index was moving of it's own strength.
But is the connection between the dollar and SPX broken - I don't think so. SPX is just ignoring the dollar CORRECTION.
When the correction is over and the dollar continues it's trend the SPX acceleration will start.
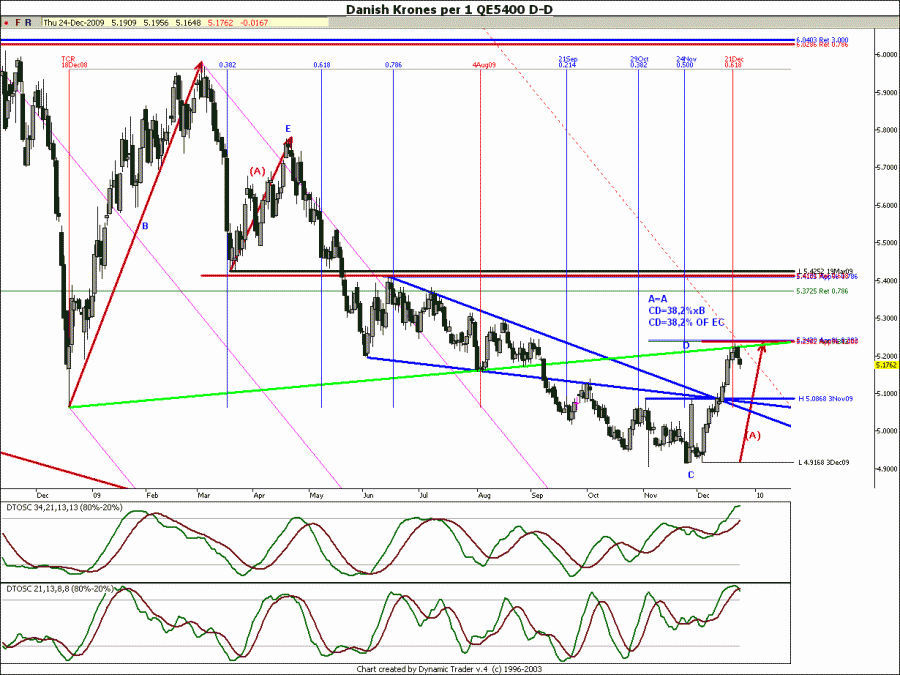
And I think it's soon - In this dollar chart (in Danish kroner - substitute for the Euro and inverse) we can se that there is a strong argument that the correction IS over. (one argument is that the USD often changes direction around Equinox).
The length of this correction is equal to the March 2009 correction - exactly and there are two more fib restances above the top + plus a trend line and a warning line from a pitchfork.
Timewise we have perfect Fib spiral (Dynamis cycle) ending in the top. And notice the last two days - bearish engulfinga followed by a hanging man.
My guess is therefore that a falling dollar next week will push stocks even higher and spook even more people who don't understand that this is a MEGA break out we are witnessing - not a top.
But of course - if you don't keep long term charts, there is no way of knowing.
But I do (keep the charts)!
And here is another one of SPX. It's another one that flies under the radar.
Again - things repeat, but when they suddenly stop - whatch out.
But of coures, you must know what is supposed to happen before you can judge if it's happening or not.
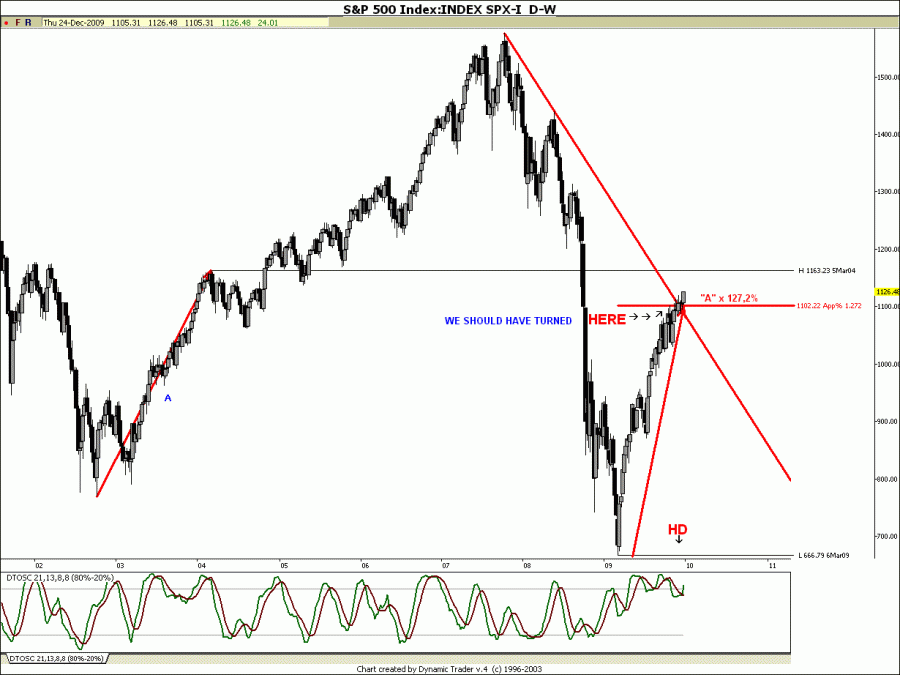
In this case, we are comparing the first upmove from the 2003 low with the first upmove from the 2009 low.
And if you know that that the most common fib ratios for corrections are 78,6% - 100% and 127,2% you "know" , that when the present rally exceeds the 127,2%, then something fishy is going on - looong term. And when we see the "Hidden Divergence" - long term - we should understand that this break out is real and we can expect higher prices ahead..
Another clue is the "Failure Clue".
The good thing about this clue is that it tells you something about the beaviour of the upcomming move.
Usually, what happens after a failure, is that price accelerates in the opposite direction of the failure.
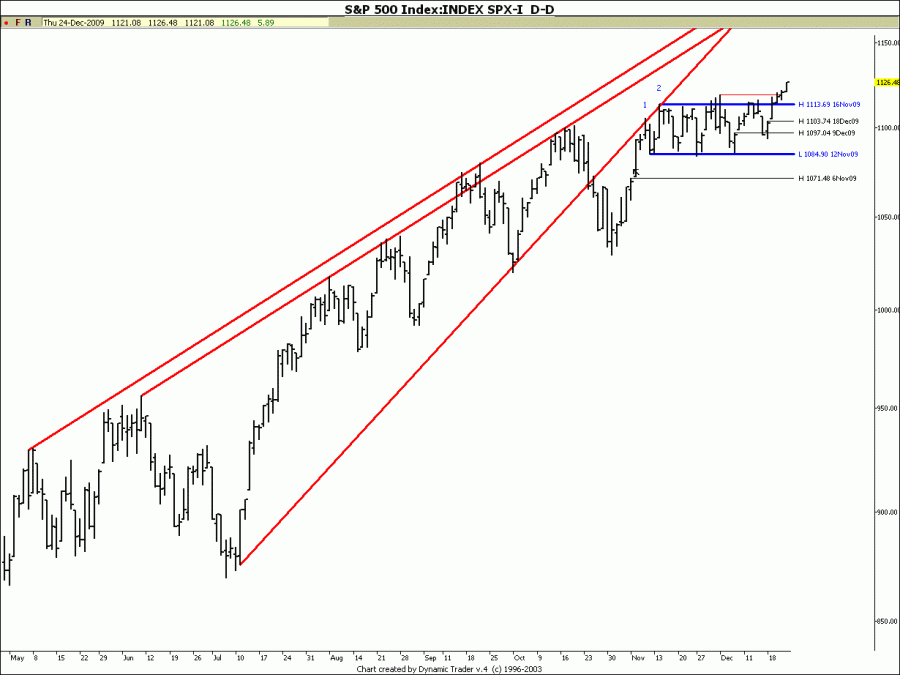
In the chart below we have the Wedge the whole World has been talking about - it's been on almost every website on the internet. And everybody knows it's bearish. Hence people have positioned themselves accordingly. But when the fall from the wedge doesn't materialize most people don't understand the implication, but instead conclude that Techniacl analysis doesn't work.
But it DOES work, because when a pattern fails it has the concequence I just explained.
In this chart we see the break down, followed by two tests of the lower line from below - so far so good. But when, instead of falling, after the test, the index starts building a bullflagh - and of the "straight" type instead of the "sloping" type, we know that someting else is going on - and it's not bearish.....
I'ts bullish - especially when we break out on the upside like we did this week.
So now everybody who positioned themselves according to the bearish wedge, they have to reconsider. And reposition....
Now this chart is really interesting.
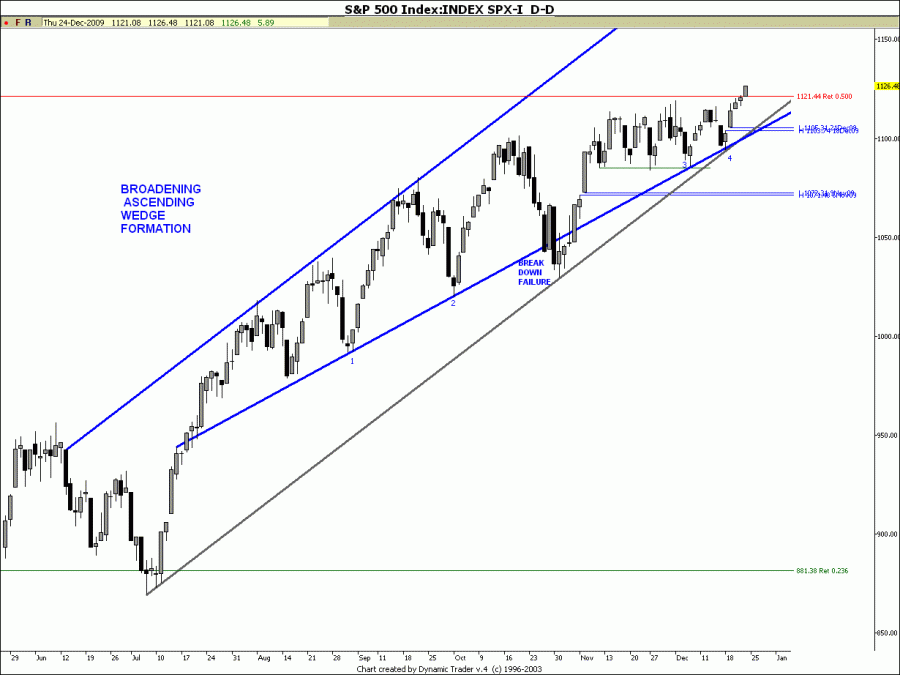
It's the same chart with new lines. And we see (?) two things.
1) A parallel up channel (upper blue line and lower grey line)
2) But it's the blue "ascending broadinging wedge", that Bulkowski descibes in his book, that interests us.
The lower line has 4 perfect connection points - two on each side of the breakdown (FAILURE)
And now it get's serious - Bulkowski's statistics tells us that the failure rate of this formation is only SIX percent!!
Hence they alsmost never fails!
So when they DO fail, it's serious and when, later, in this chart, we break above the 50% retracement after two perfect tests of the lower trendline, the case is closed. We should be looking for a powerful move ahead, which the dollar/spx discussion, above, allready has suggested.
And talking about failures
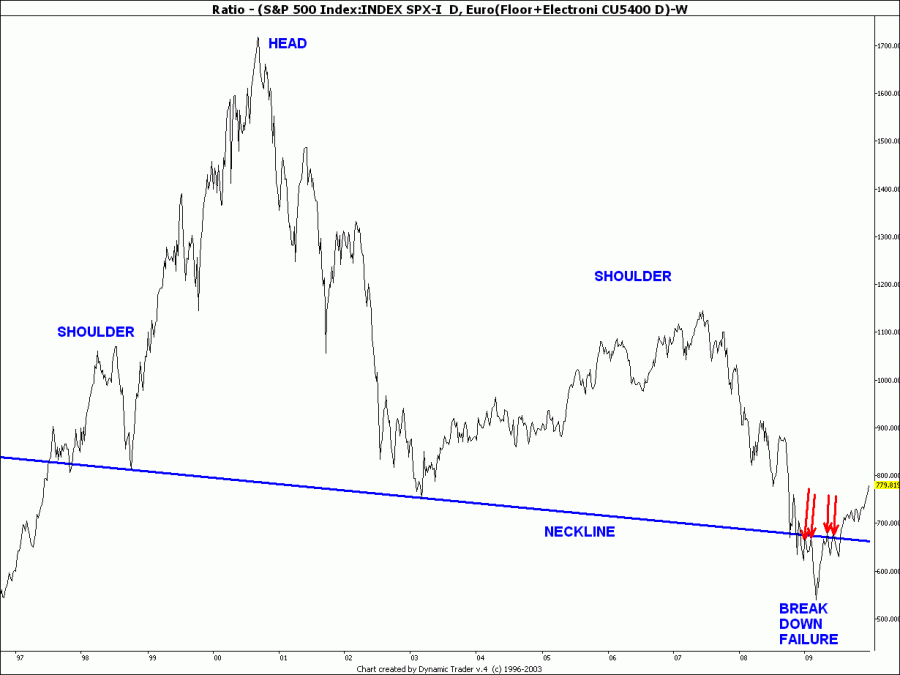
This is the mother of all failures. In a chart one almost never sees.
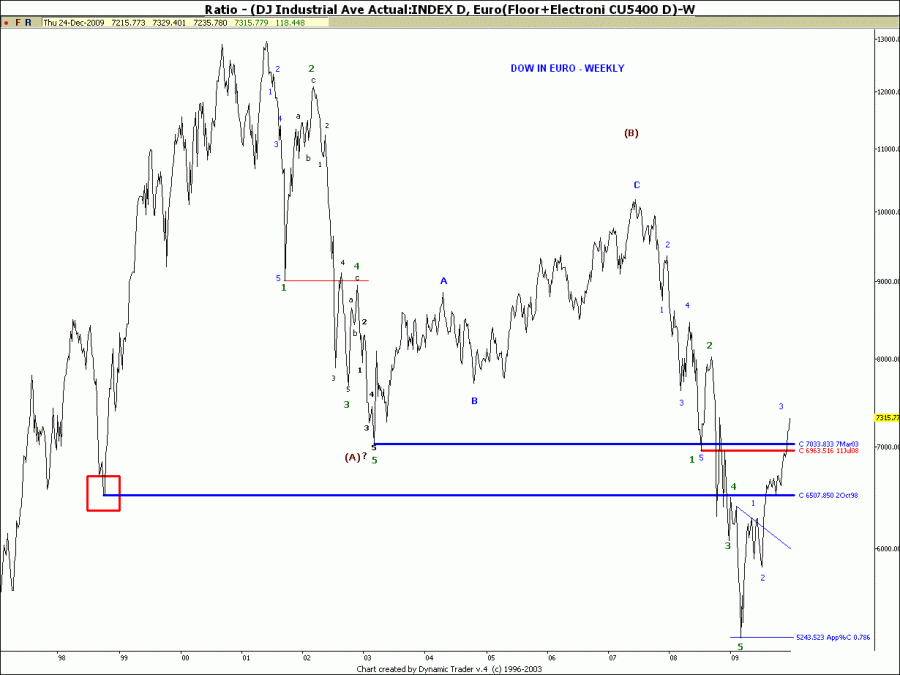
SPX in EURO!
If you chart the US indexes in euro, long term, you will be surprised how precisly the lines and fibstudies fit with price - better than i USD as a matter of fact. Which you will se in some of the following charts.
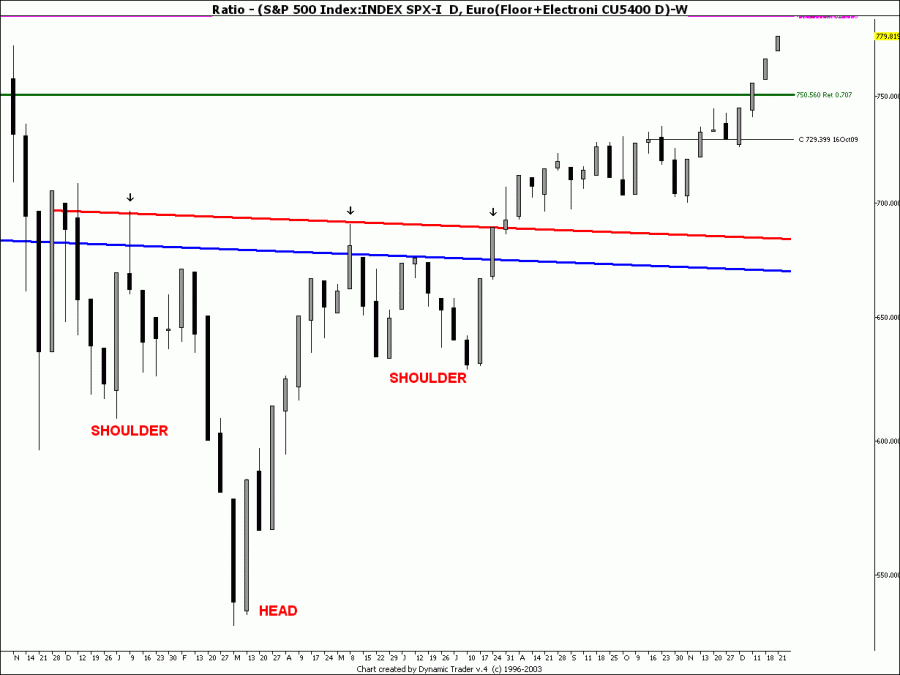
Let's start with a weekly chart of SPX in Euro.
What we 1st notice, is that the long term doubletop is gone. Instead we have a gigantic H&S pattern.
But not only that -Under the neckline to the right, we have an H&S FAILURE!
We are back above the neckline.
And what drove us upp above the line was an inverted H&S the most common bottom pattern.
A close-up reveals the precisenes I was talking about. The red neckline is a paralell clone of the long term blue neckline - and it hits price exactly 3 times and the three last weeks takes price above the 0,707 level.
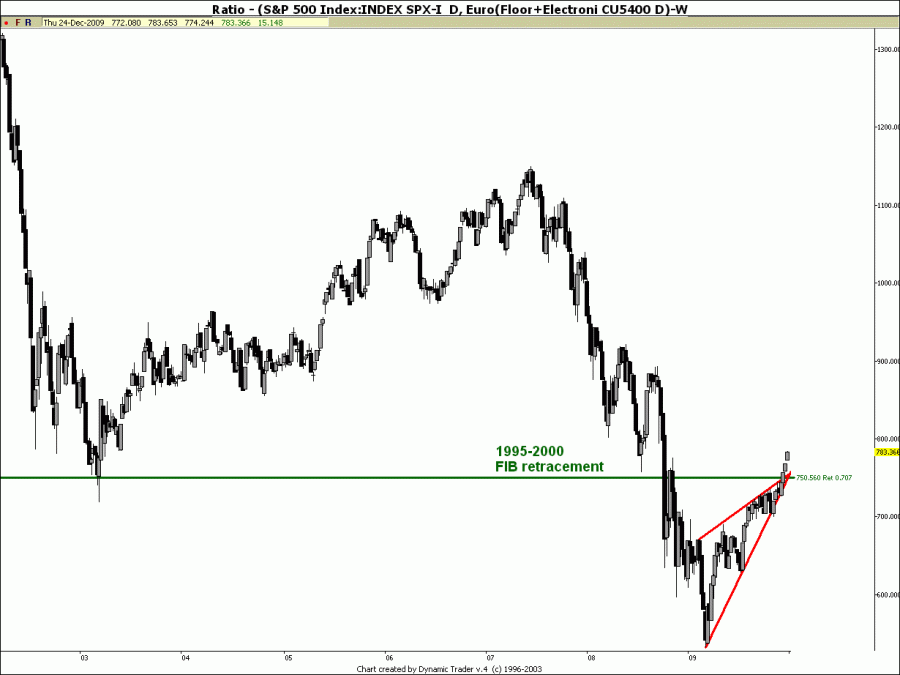
So what's a 0.707 level? It's half of the sacred root of 2 =1/1,414 or 1,414/2, which often works the same way as fib ratios.
In this chart - this ratio stopped the correction - in 2003 - of the 1995-2000 upmove.
Moved out to the right we see that - price three weeks ago, broke above the level (it's still active) at the same time we broke out of the rising (bearish)wedge almost at the apex. One of the most potent breakouts in TA.
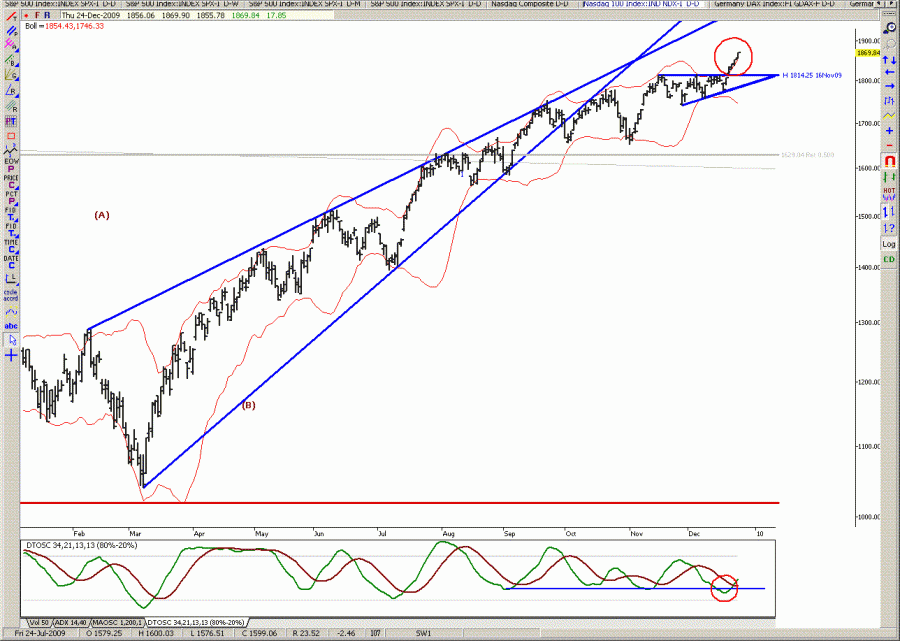
But even if you don't chart in Euro, I am surprised that so littel of the discussion is focused on Nasdaq, which is known to be the leader af any important move - up OR down.
In this chart we see the "same" wedge as in SPX and the same behaviour + a powerful break out of an ascending triangel (a type of pattern that has 2% - I repeat 2% failure rate according to Bulkowski)
And check out the bullish "Hidden Divergence"
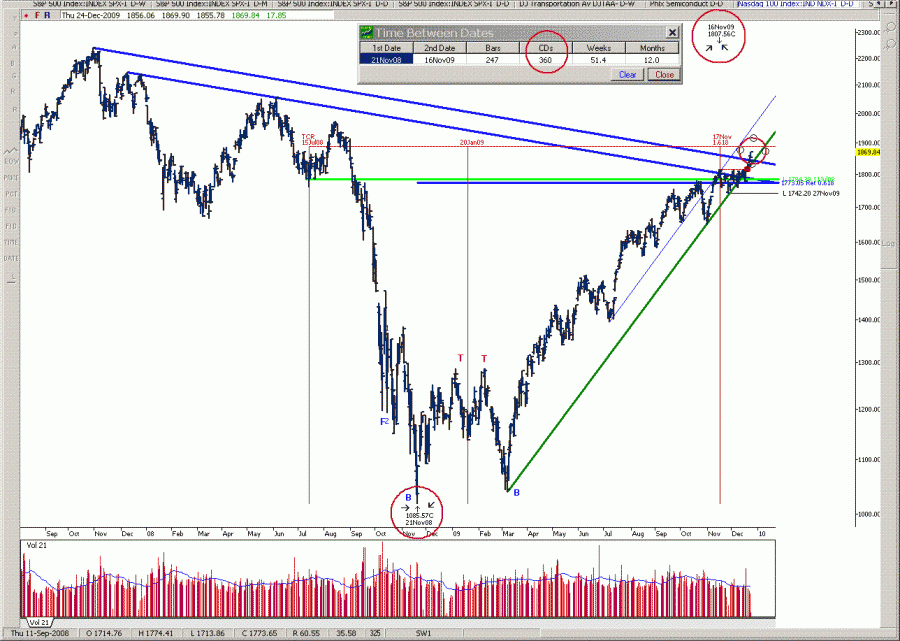
Let's look a little more long term at NDX and let's focus on TIME.
From the March bottom to the november high - it's 360 Calendar days.
That's classic Gann for trendchange.
Price wise we were att at the right spot for at serious correction. And now also Time wise.
We have for instance a perfect dynamic (fib) cycle ending November 17 where the lower trendline hits.
Time and price was ripe for a correction
BUT IT DIDN'T HAPPEN!
So here we have the Sherlock Clue again.
Price, instead of reversing seriously, only went down to the green major support line - worked at it for a while and then went up and broke the upper blue resistance line
This weekly NDX (in EURO) reveals break of the red falling resistance line that has been hit 3 times before.
It's , in time, at two perfekt dynamic cycles that ends nov 12 and two fib resistances.The long term cycle's base is 1987 bottom and 2000 top. Nov17 is 78,6% of that base.
Check out the perfect double bottom, you don't see in NDX dollar chart.
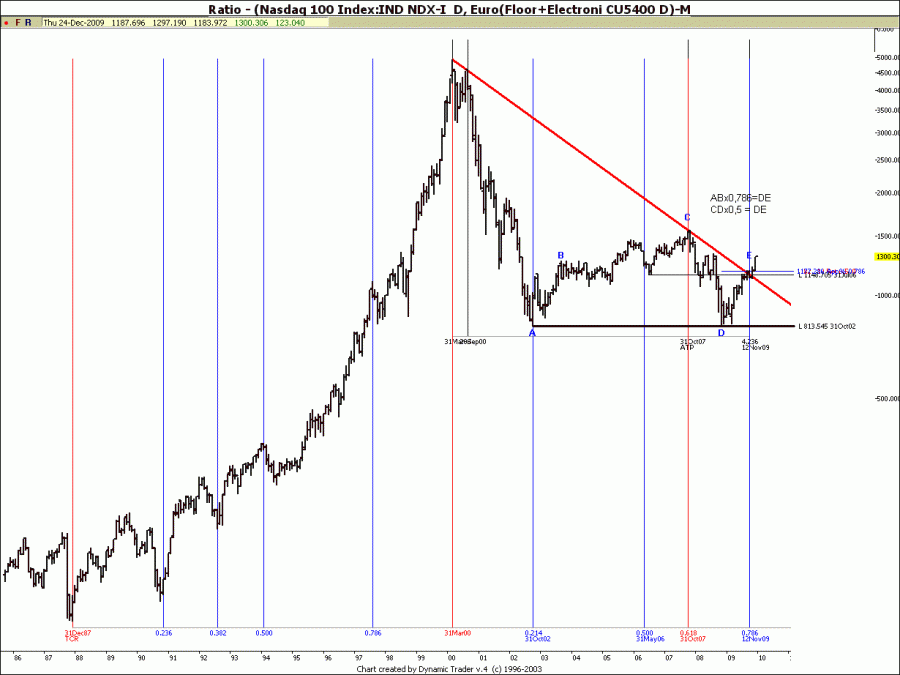
Back to failure theory.
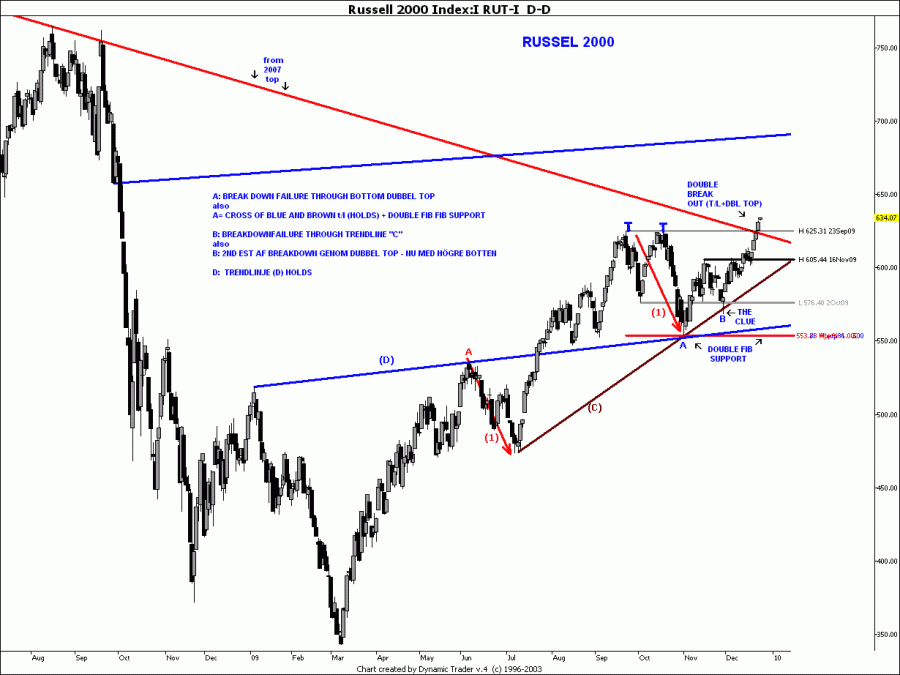
We have a double wammy in the russel2000 chart.
Break down faillure of the double top, that is stopped by the trendline cross (and fibsupport) at "A" + plus tha small failure at "B", which is the small failure that often passses un-noticed if you are not used to them. It often preceedes a steep rise. Leke here...
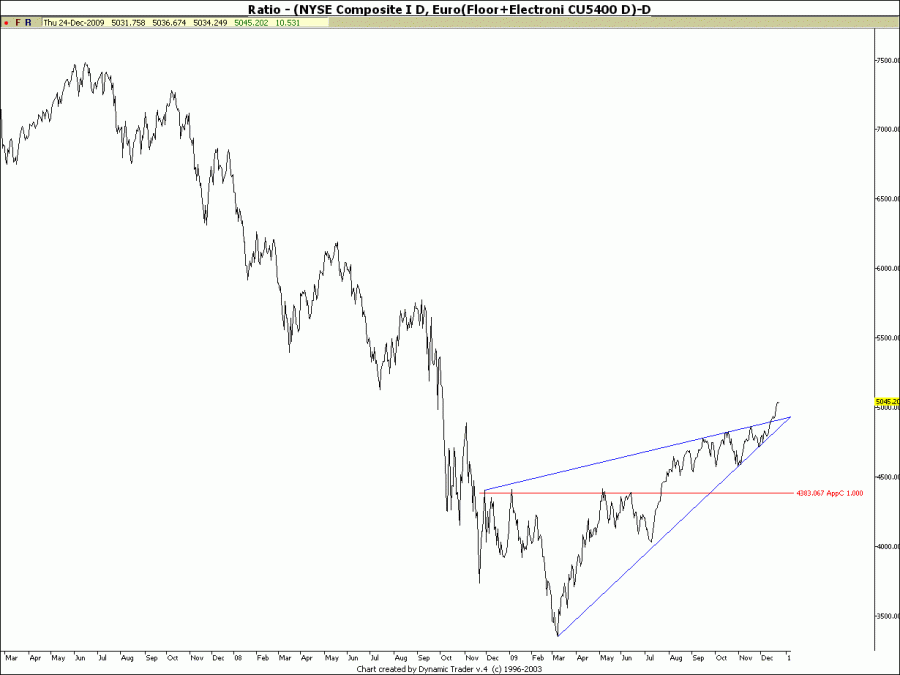
NYSE daily, close only.
Another beautiful rising wedge that breask close to apex - very bullish
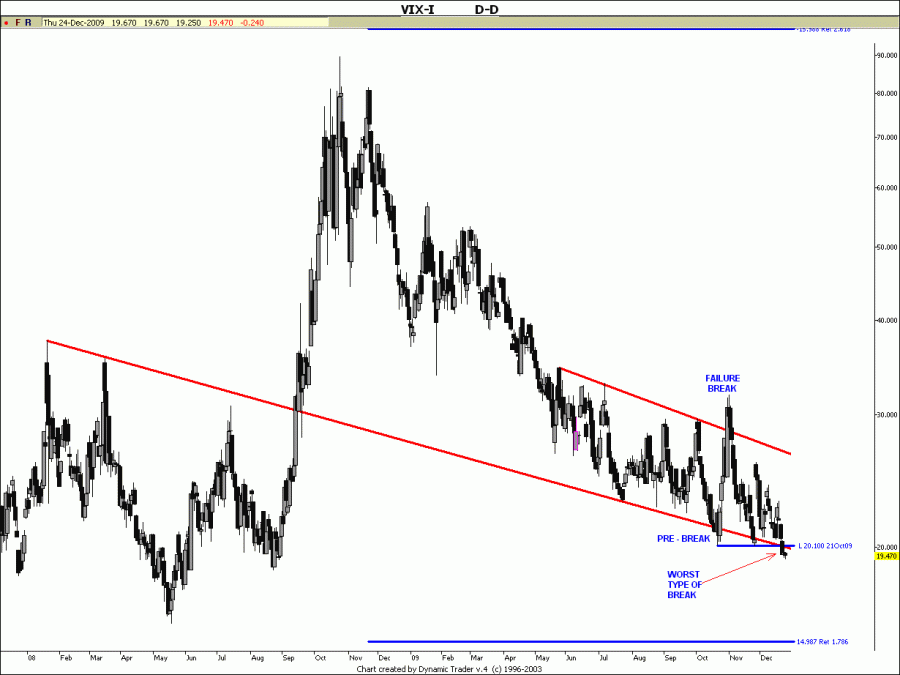
There are three kinds of important breaks
1. Failure breaks
2. Pre breaks
3. Real breaks.
The problem is that you don't know what the first one is until after some time, but it's worthwhile to keep track of them, since breaks 1 and 2 more often than not is followed by a sharp move
1)In the other direction than the direction of the failure break
2) In the same direction as the pre break
In this VIX chart we have them all. My take is that we are now seeing the "real" break.
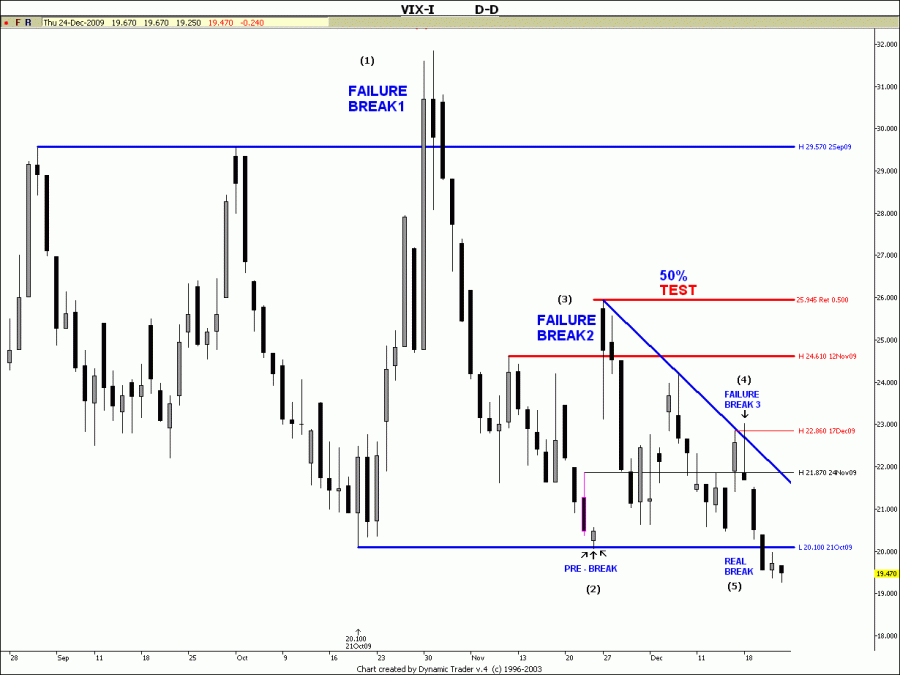
That conclusion fits into this picture, where we now break through a double bottom and through a falling trendchannel. Breaking in the same direction as the the direction of the channel, ofter results in speedy moves - especially if it's a downsloaping channel.
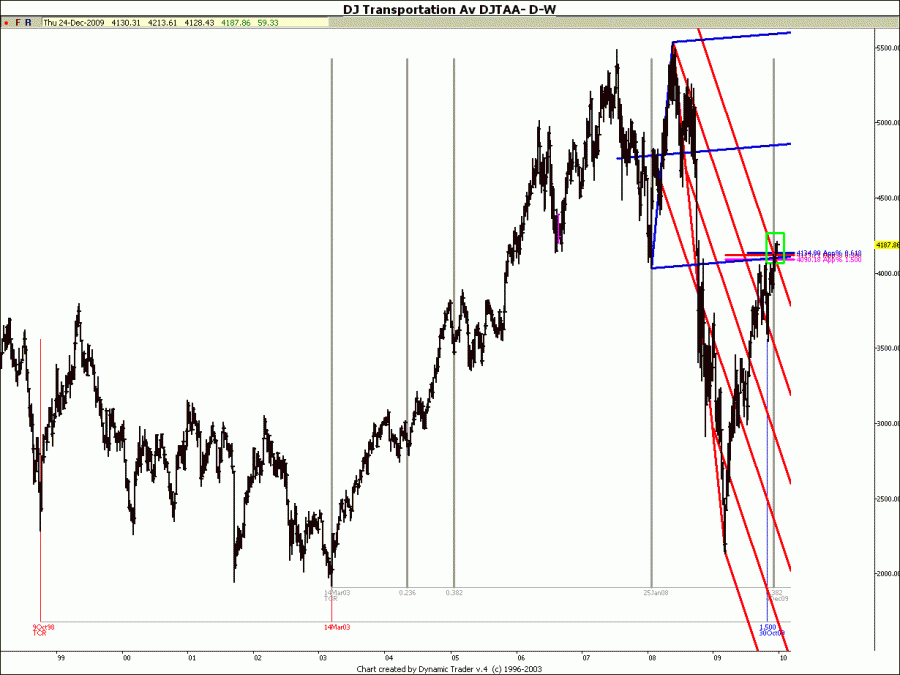
Finally a short look at the Transportation index, which also broke an important level this week.
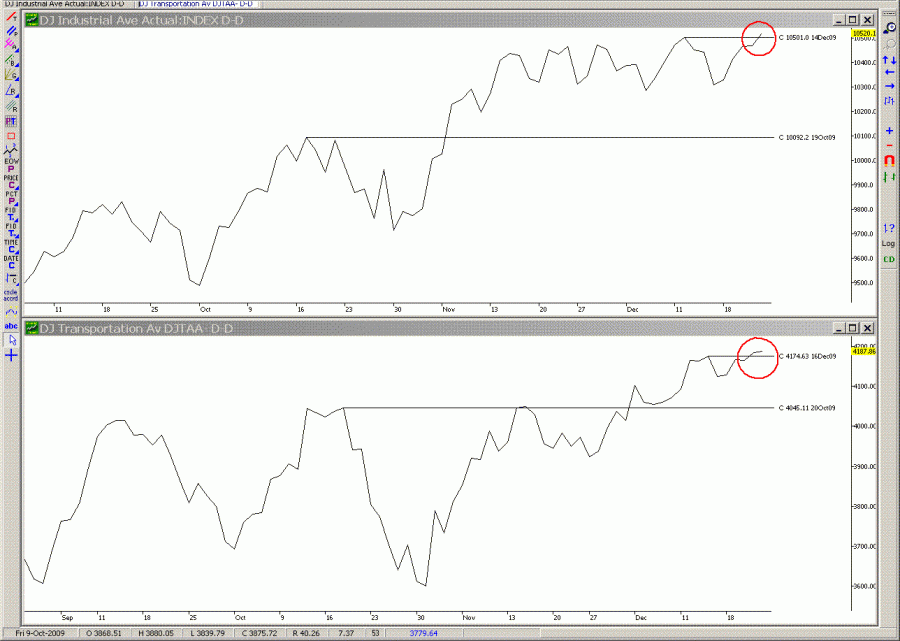
But the main reason we look at it, is because we have a confirmed DOW Theory situation where the the industrials and transportation index confirms each other - so far.
Well, I think I've made my case.
We MAY have a short pullback to confirm the break out, but with so many people don't realizing it's the break out of the year, they will continue to argue that and that we are seeing exhaustion moves.
In my opinion we are in bullmarket and we are in wave 3, where "everybody" IS right. therefore , high bullish consesious is meaningless.
And what I find VERY interesting is Arbman's discussion with a couple of people, since I understand he is responsible for other people's money. My understanding of that discussion is that arbman is not a risktaker and mainly on the sidelines, as many other moneymanagers are.
I have a very wealthy friend (HE is....) and I sent him an mail last weekend sharing my opinion on the market with him. So he called me and we discussed the situation. He told me he had had to large money managers at home discussing the situation and I asked him their opinion (they were of course fundamentalists). He told me they did not actually have an opnion (theyu don't know anything he said...) - and that they were very nervous. They absolutely did not advise him to go into stocks againg. He even had a large loosing shortposition, that he was hoping should give him some money when the REAL crash would come - and he continued citing Financial times articles, that was/is his main information source, appart from these guys.
Also I share my market letter with a couple of guys who write for customer's of investmentfirms and banks. The are equally nervous. Not neccesarily waiting for the big one, but a very large correction. But they are WAITINg!
Hence I think we will have a runaway market ahead of us, since that is what almost NOBODY expects and its typically the reaction from failures. People don't really have respect/knowledge for failures and especially not of failures on a mega scale, that the breakdown failure was in March 2009 (Dow,SPX COMPQ - but NOT (!) NDX - another mega bulldivergence).
Themarket loves new situations and this situation definetly is new.
Edited by Stickan, 26 December 2009 - 10:42 AM.


