I'm not particularly hip to cycles, as they
often seem to be dancing the mambo:
He goes left
She goes right
Papa is looking for Mama
But Mama is nowhere in sight...
Nevertheless, here is a timely post by Raj.

A Cycle
Started by
selecto
, Nov 11 2012 09:41 AM
37 replies to this topic
#2

ogm
-

- Traders-Talk User
- 13,780 posts
Member
Posted 11 November 2012 - 10:06 AM
Don't mean to be negative's on anyone's analysis. But I've personally never believed in cycles, except maybe a longer term ones or e-wave ( yeah, yeah, hate me for that  )
37 day cycle, 139day cycle... are these arbitrary numbers ? why 139 days ? What significance do these numbers hold ? they aren't even Fib numbers. Just curious why those particular numbers were chosen for analysis.
)
37 day cycle, 139day cycle... are these arbitrary numbers ? why 139 days ? What significance do these numbers hold ? they aren't even Fib numbers. Just curious why those particular numbers were chosen for analysis.
)
37 day cycle, 139day cycle... are these arbitrary numbers ? why 139 days ? What significance do these numbers hold ? they aren't even Fib numbers. Just curious why those particular numbers were chosen for analysis.
Edited by ogm, 11 November 2012 - 10:10 AM.
#3
robo
-

- Traders-Talk User
- 1,218 posts
Member
Posted 11 November 2012 - 10:18 AM
I'm not particularly hip to cycles, as they
often seem to be dancing the mambo:
He goes left
She goes right
Papa is looking for Mama
But Mama is nowhere in sight...
Nevertheless, here is a timely post by Raj.
It's the dollar cycle that I'm watching and we should be close to a top..... Add in Sentiment Trader Data - NAAIM's -Top Timers now Bearish with 3 Bulls, 6 Bears, and 1 neutral - Plus the Cycle data and the downside risk is now much less then the upside in my opinion. Sure we can go lower, but I will be adding longs.
I dont always agree with Jeff, but I do on this one....Watch the dollar - this cycle is coming to a end.
http://www.growthsto...Heading-Our-Way
Good luck to all next week.
Long GDXJ and GDX
Edited by robo, 11 November 2012 - 10:25 AM.
" “There is only one side to the stock market; and it is not the bull side or the bear side, but the right side” Jesse L. Livermore
#4
selecto
-
- Traders-Talk User
- 6,871 posts
Member
Posted 11 November 2012 - 11:52 AM
I agree Robo. My mo screen of SPX:USD suggests that some kind of SPX price advanvce in here is inevitable.
#5
beta
-

- TT Patron+
- 4,217 posts
lasergirl
Posted 11 November 2012 - 01:22 PM
[deleted - sorry cant post chart]
400 pt rally is not out of the question ...
Edited by beta, 11 November 2012 - 01:28 PM.
"Daytrading -- An Extreme Sport !"
#6
CLK
-

- Traders-Talk User
- 10,787 posts
Member
Posted 11 November 2012 - 03:06 PM
Selecto,
I'm having trouble folowing your takes. It seems you post a chart of a good system and when it does not work
you move on to something else. This one failed and now has the same CCI signature of the 08 crash, although if
it does, the magnitude won't be the same.
And Thur. morning you posted a daily BB chart looking for more down, that worked, but your post seemed to suggest more
than just a one day event. Now you are looking for a rally. How in the world do you trade what you post without losing ?
#7
ogm
-
- Traders-Talk User
- 13,780 posts
Member
Posted 11 November 2012 - 03:28 PM
CCI signature of the 08 crash, although if
it does, the magnitude won't be the same.
Still the acceleration as we break the bottom trendline of this rising wedge can be quite painful. Because this what that CCI Implies, the trend is accelerating.
Edited by ogm, 11 November 2012 - 03:28 PM.
#8
CLK
-
- Traders-Talk User
- 10,787 posts
Member
Posted 11 November 2012 - 03:41 PM
CCI signature of the 08 crash, although if
it does, the magnitude won't be the same.
Still the acceleration as we break the bottom trendline of this rising wedge can be quite painful. Because this what that CCI Implies, the trend is accelerating.
This latest breakdown from the consolidation looks similar to the June bottom, only this time the breakdown does not look terminal on the hourly chart,
it's been correcting while it's dropping, looks like wave 3 of 5, and I don't really care for ewave, but I know a fast move from a choppy one.
#9
selecto
-
- Traders-Talk User
- 6,871 posts
Member
Posted 11 November 2012 - 03:44 PM
The CCI study on the weekly chart is making an uncharacteristic complex bottom. I believe its a bit too soon to call the signal a failure.
On the TNA BB chart I observed a BB expansion and the 3 ema, and suggested price would move in that direction. The move, called before the open on Thursday totaled 2.87 TNA points and 17.02 SPX points from then to the low on Friday. There was nothing in that post which suggested the duration of the move, only that it would likely happen and it did. There may be more, but I have doubts.
I don't trade off that stuff, just keep it running to try to understand the mojo above the 15 minute. 
Edited by selecto, 11 November 2012 - 03:46 PM.
#10
DrSP
-

- Traders-Talk User
- 2,391 posts
Member
Posted 11 November 2012 - 03:45 PM
CCI signature of the 08 crash, although if
it does, the magnitude won't be the same.
Still the acceleration as we break the bottom trendline of this rising wedge can be quite painful. Because this what that CCI Implies, the trend is accelerating.
This latest breakdown from the consolidation looks similar to the June bottom, only this time the breakdown does not look terminal on the hourly chart,
it's been correcting while it's dropping, looks like wave 3 of 5, and I don't really care for ewave, but I know a fast move from a choppy one.
If in doubt, I step aside. For me, there is no risk of capital. But, I don't look at oversold indicators and throw my money into the fire.
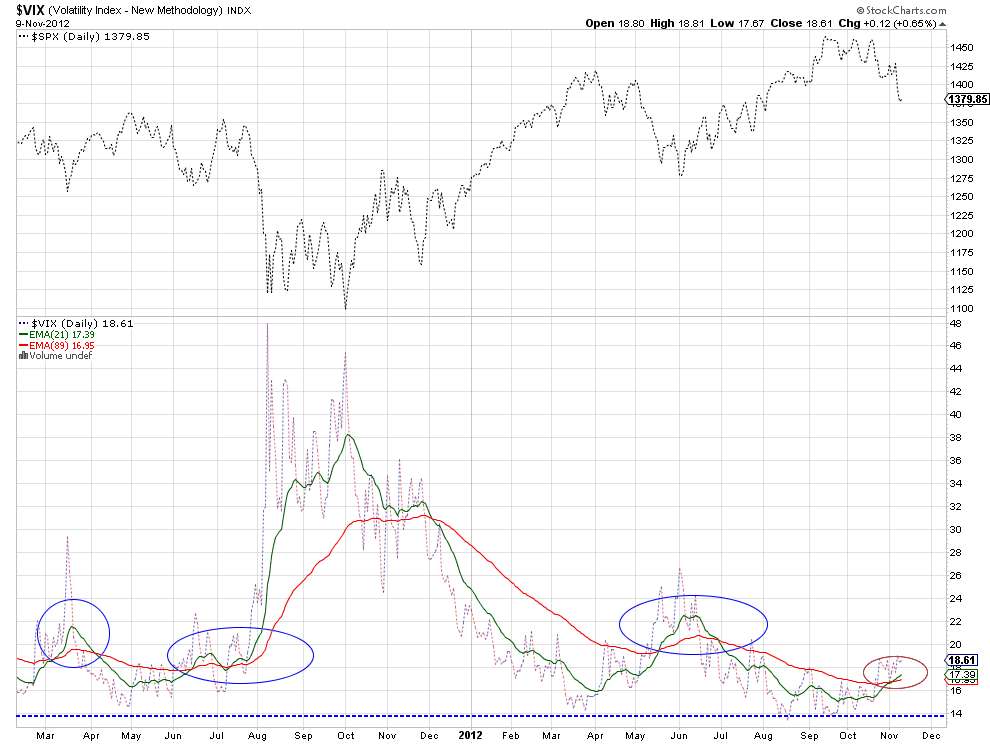
Just FYI, I posted this yesterday, green line crossing up is bullish for VIX. Blue line is the base in VIX forming for several months.
You could be a billionaire or an industrial worker or a teacher or a moderator of a forum - Hold a good conscience because that is what matters.


