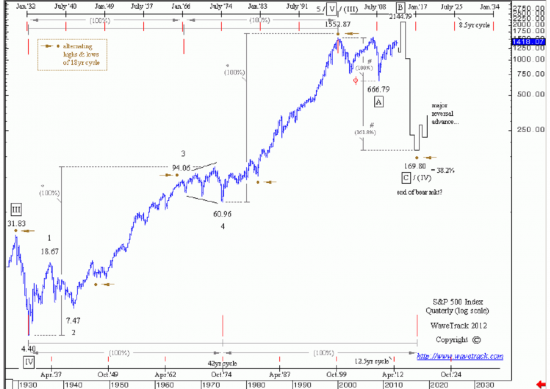
It's been some time since I've last posted here. In the past, I was persuaded that the high the SPX saw in 2000 was a Wave-III high, rather than a Wave-V high, and called for several years for a Wave-IV to play out. It finally did so in early 2009, and from my perspective, we pushed upward to wave-A of diagonal triangle at the 2130s and fell back in wave-B at the recent lows of 1810.
If my count is correct, we are about to move upward again in wave-C, and this should take us to new highs. The chart I share here was prepared before the trading day last Friday and while it remains to be seen what exactly will play out, as there are several price possibilities above, this is just one possibility, based on the pattern of the diagonal triangle that ended the move up from 1998 to 2000.
Finally, the time I pushed out the possible pattern is not what I suggest will play out, but merely a pattern that could play out going forward, as I do not see the topping process lasting beyond 18-months from now.
Just my two cents worth...
http://postimg.org/image/ah2u7xerl


