Jump to content


Photo

Market Geometry for Long-Term DJIA


  • Please log in to reply
3 replies to this topic

#1 Kimston

Kimston

    Member

  • Traders-Talk User
  • 604 posts

Posted 22 January 2021 - 12:19 AM

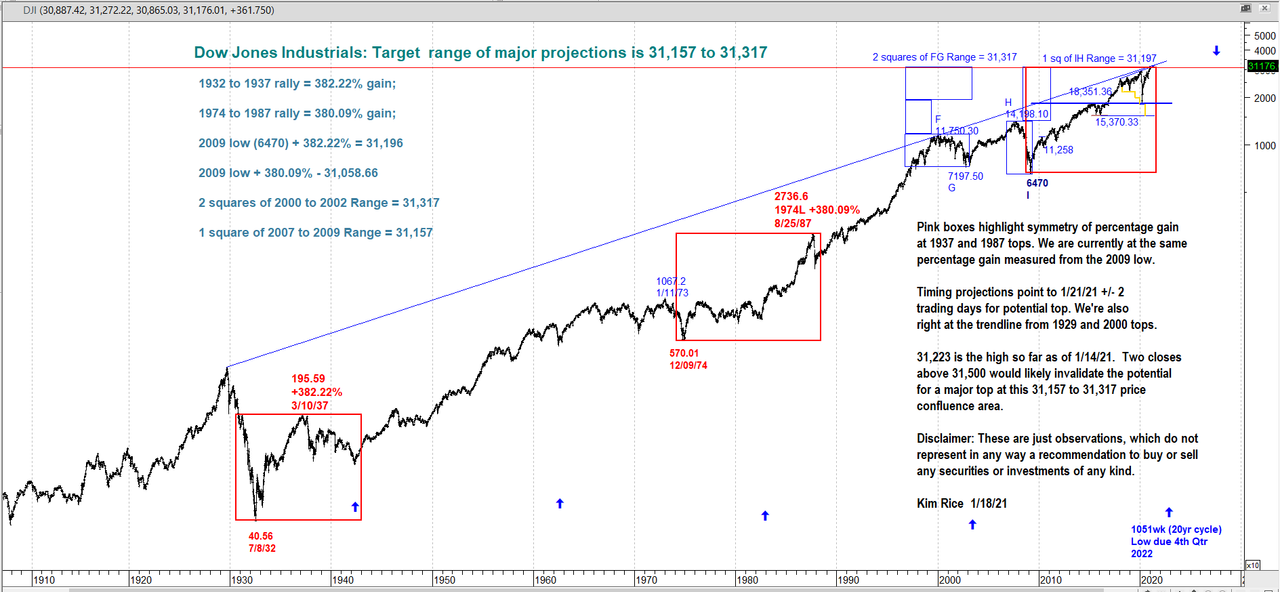
I've had a major target around 31,200 - 31,300 on DJIA for about 10 years now. The symmetry looks compelling for a significant top. Went pretty heavily short (hopefully for a multi-week trade) when we popped above 31,200 and will stop out on close above 31,550.


DJIA31200.png


#2 tsharp

tsharp

    Member

  • Traders-Talk User
  • 1,487 posts

Posted 23 January 2021 - 04:45 PM

I've had a major target around 31,200 - 31,300 on DJIA for about 10 years now. The symmetry looks compelling for a significant top. Went pretty heavily short (hopefully for a multi-week trade) when we popped above 31,200 and will stop out on close above 31,550.


DJIA31200.png


Hi Kim,


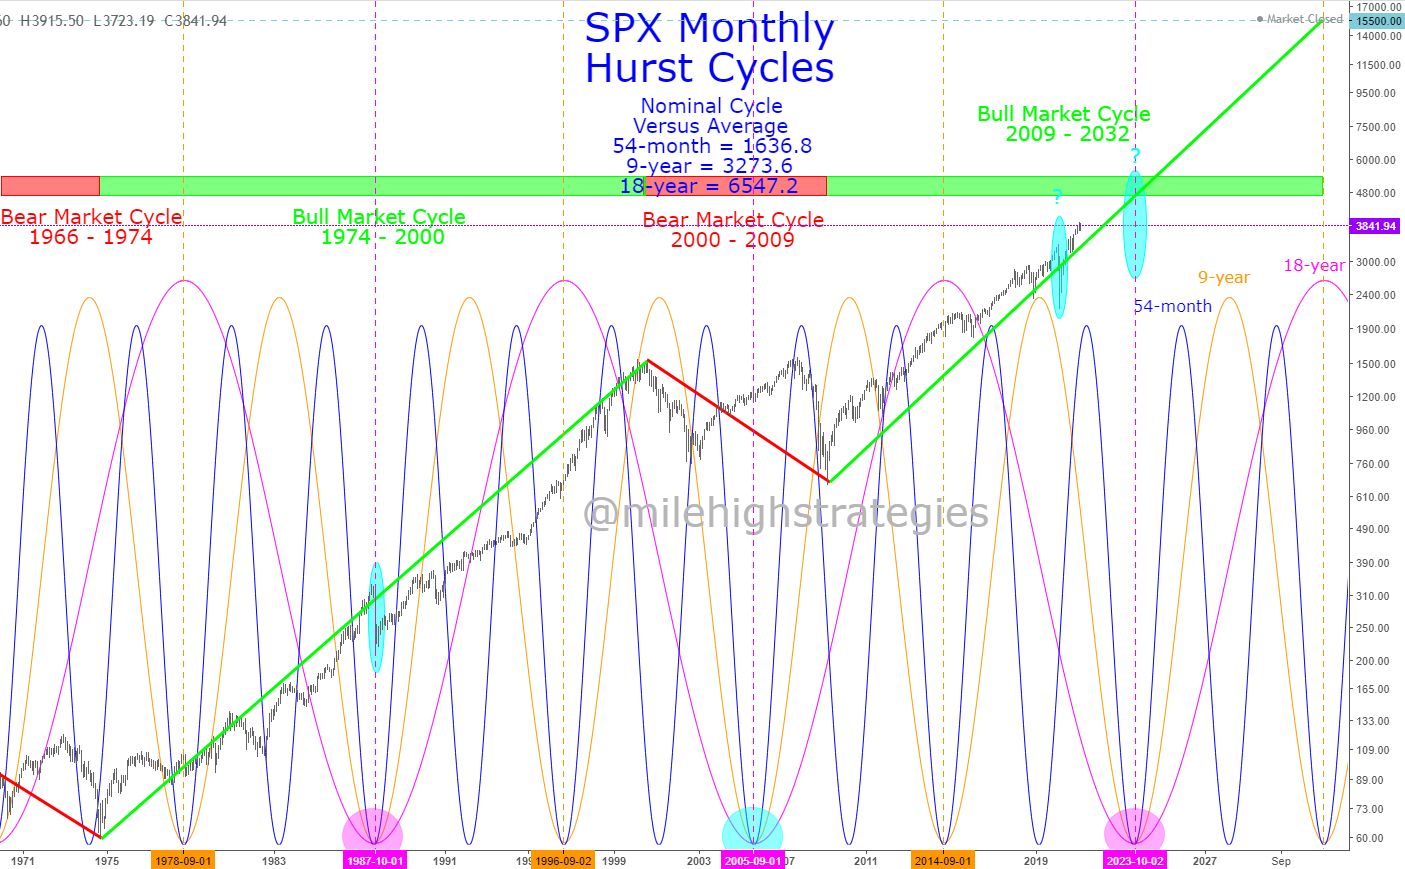
Thanks for sharing your chart and ideas here!  I do think we're getting ST toppy here, though perhaps an IT top from a bit higher.  I do see a difference between the first and second periods on your chart as the first was in the midst of a 13-year bear market cycle, and the second was in the midst of a 26-year bull market cycle, so this period would be more like the second, rather than the first. 


I do see the possibility for a sharp and fast decline in 2023-24, to mark the Hurst 18-year cycle trough, perhaps like what happened in 1987, though overall, I see the US markets continuing upward into ~2032.


SPX-M-01-22-21-LT.jpg


#3 Kimston

Kimston

    Member

  • Traders-Talk User
  • 604 posts

Posted 15 February 2021 - 08:09 PM

I had shorted via call options on DXD. After looking at geometry for SPX, I've decided to move my stop-out plan from close above 31,550 basis cash DJIA to a close above 4050 basis cash SPX. I found 5 projections on SPX that all land in the 3990 to 4012 range. I think closing above 4050 would likely invalidate this target area.


#4 tsharp

tsharp

    Member

  • Traders-Talk User
  • 1,487 posts

Posted 06 March 2021 - 09:42 AM

SPX MONTHLY HURST CYCLES UPDATE...

There are many pioneers in the the technical analysis world, Dow, Magee, McClellan and Bollinger are a few who quickly come to mind...

And in the world of cycle analysis, Armstrong, Hurst, Elliott and Kondratiev are another few who first come to mind...

These were all gifted and brilliant men who were able to think outside the box and pioneer new ways of looking at how the financial markets function...

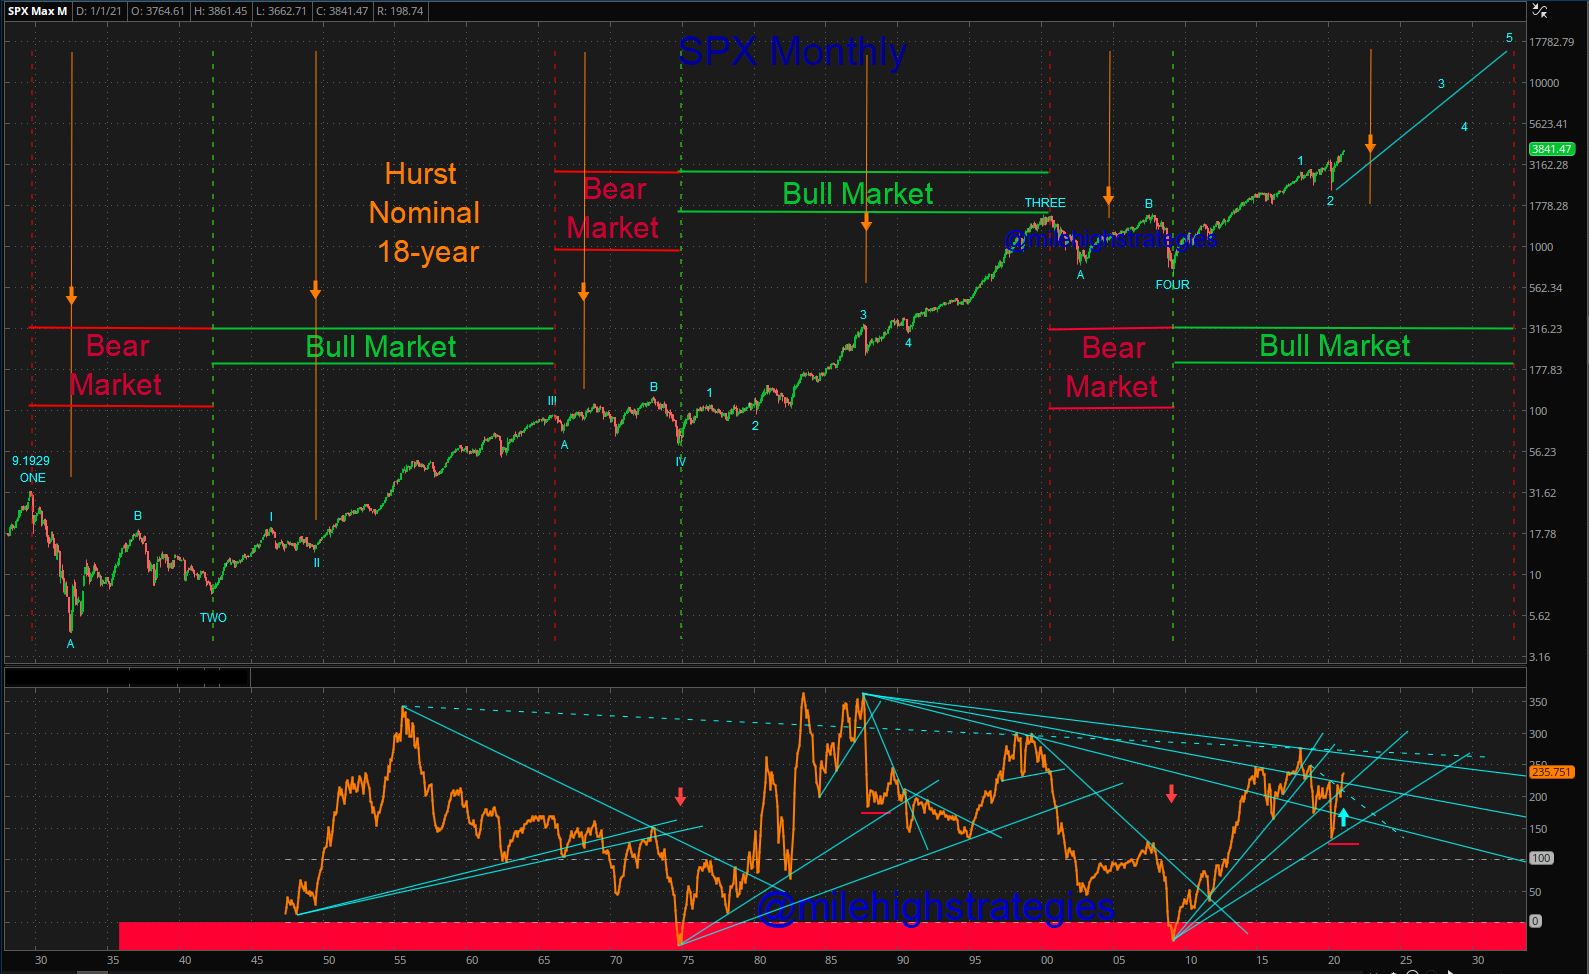
I realize I'm not in their league, though I have discovered and pioneered a new cycle which I call the Bull Market/Bear Market Cycle, that is determined by the momentum trend of the monthly SPX...

On average, a Bear Market Cycle lasts for about 8-13 years and a Bull Market Cycle lasts about 22-26 years, with the latest Bull Market Cycle starting in 2009...

What complicates matters a bit is the myriad of other cycles that need to be considered simultaneously, such as the #Hurst nominal 54-month, 9-year and 18-year cycles, and even how the confluence of these cycle troughs seem to behave differently in a bull market cycle versus a bear market cycle...

For now, I'm looking for the US equities markets to continue the upward trend of the Bull Market Cycle into ~2032, and will be watching in late 2023 to see if that confluence of cycles will create a sudden crash wave, or if it came early in 2020, due to an exogenous shock from the Coov fallout... watching.


SPX-M-03-05-21-HC.jpg