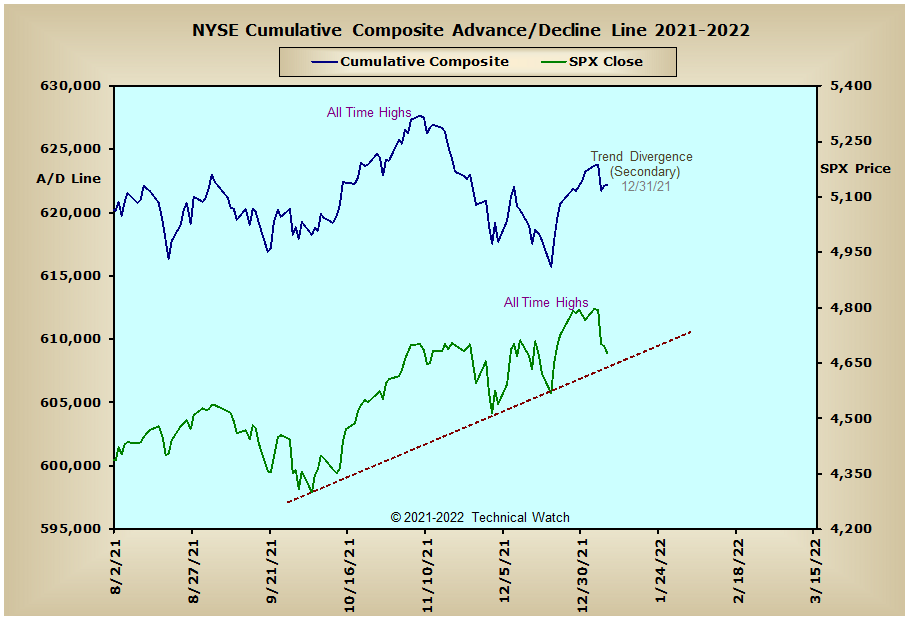
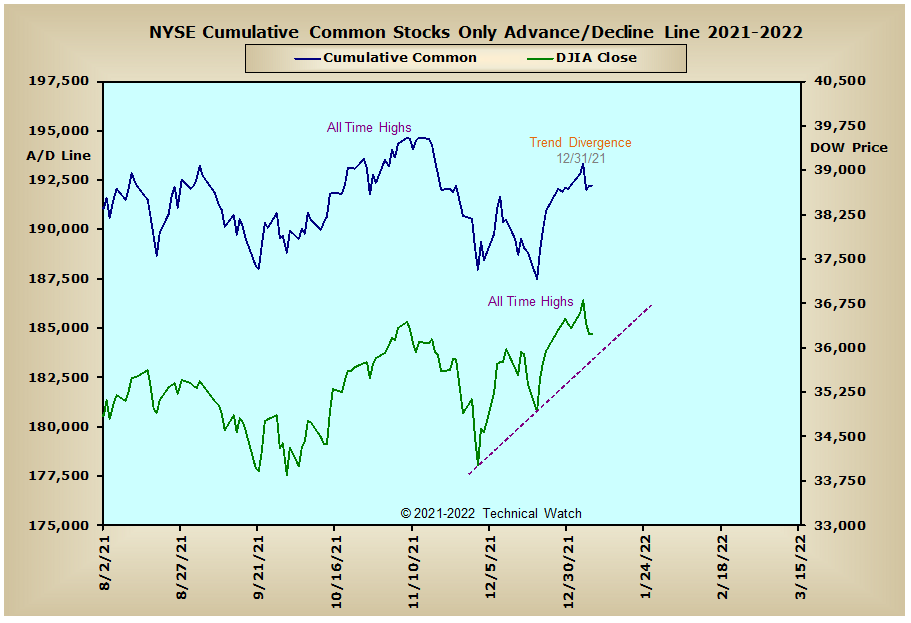
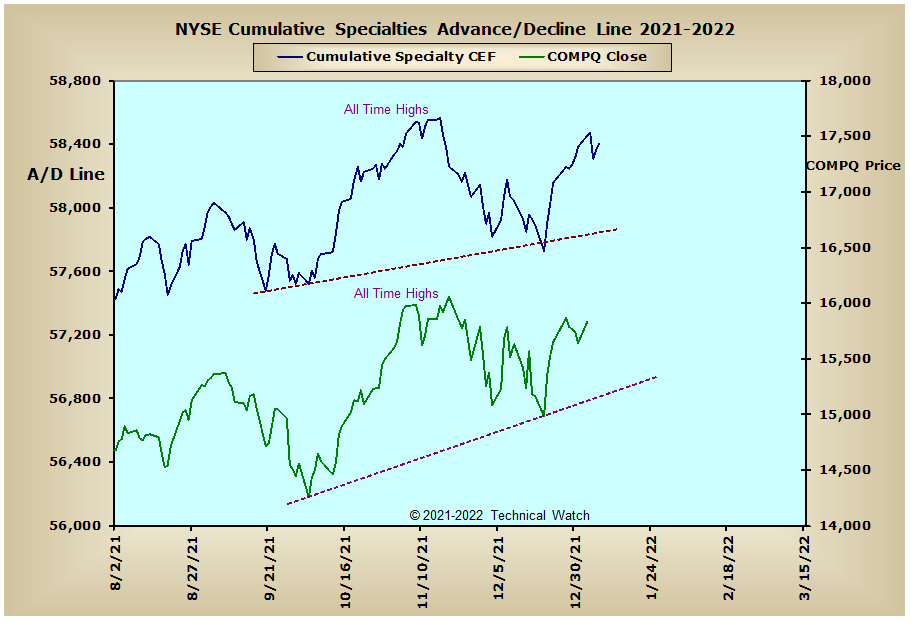
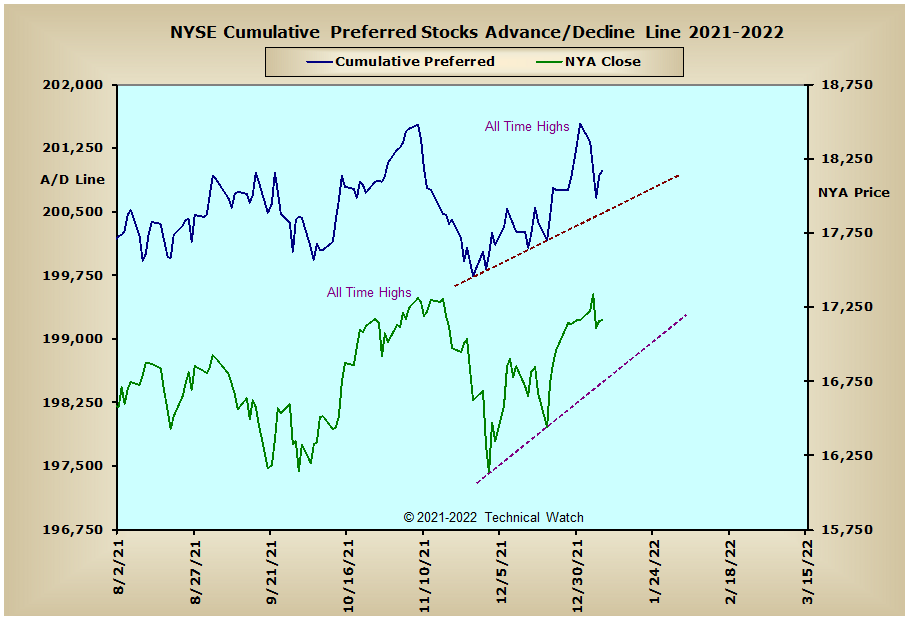
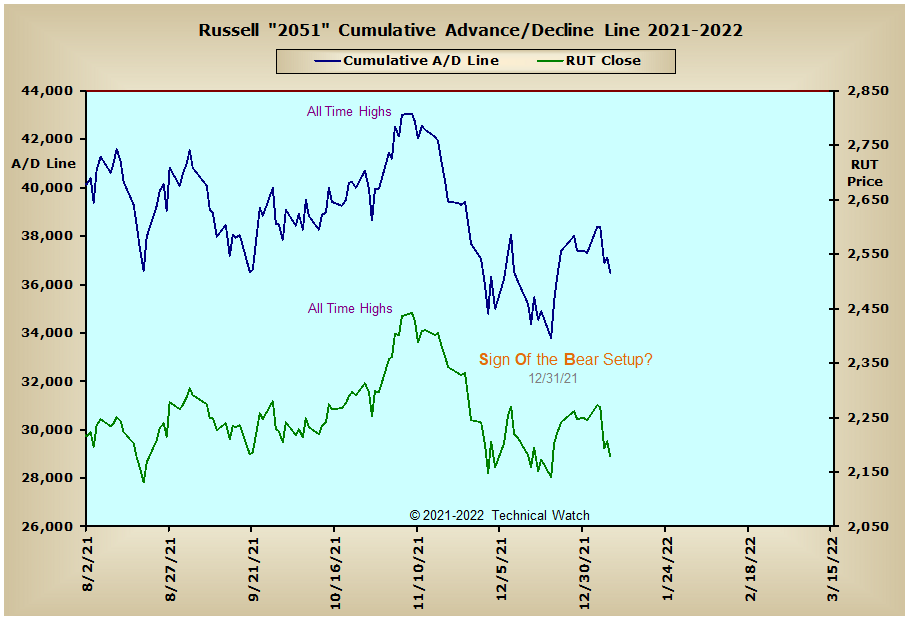
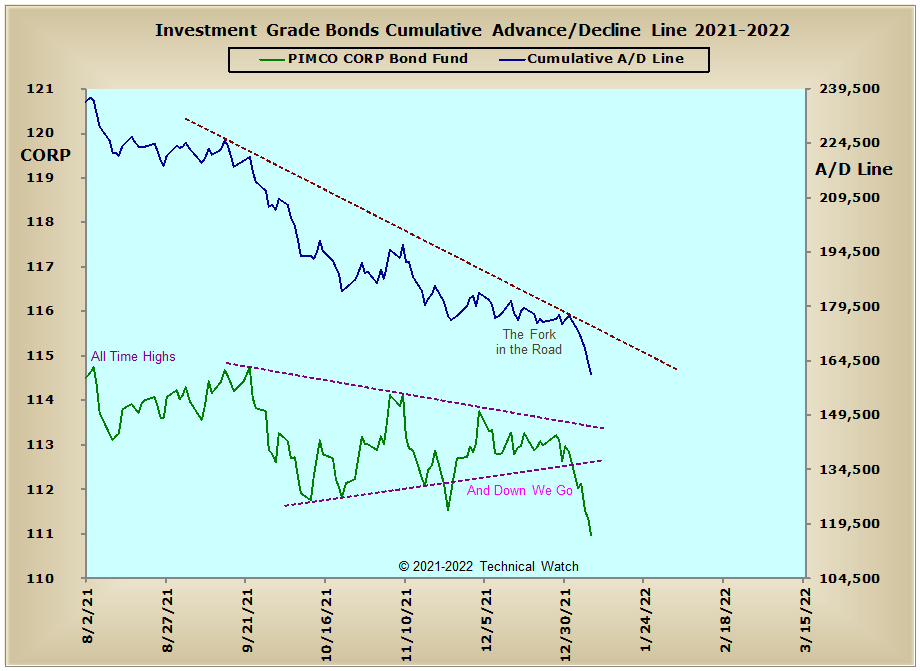
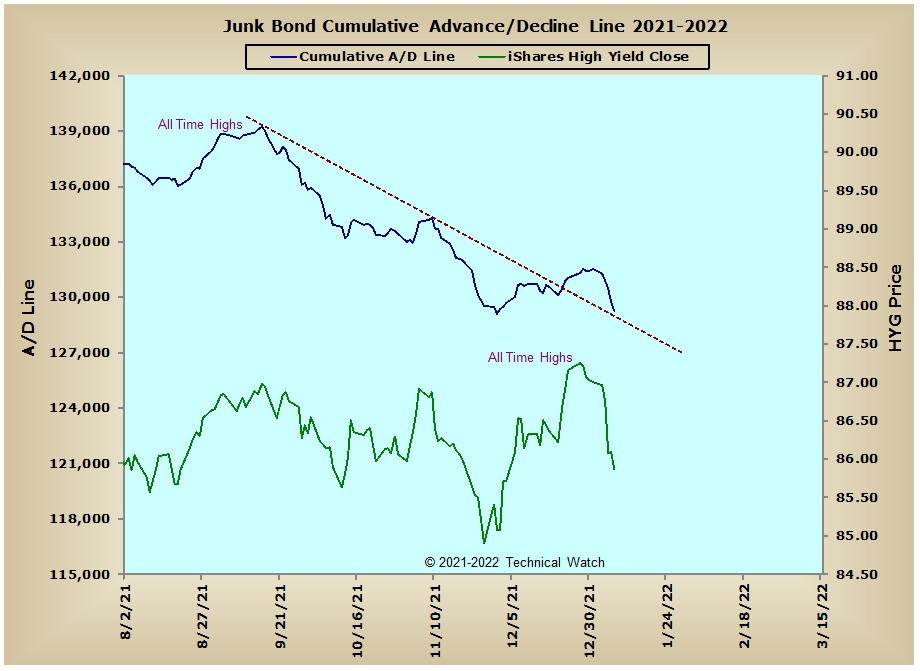
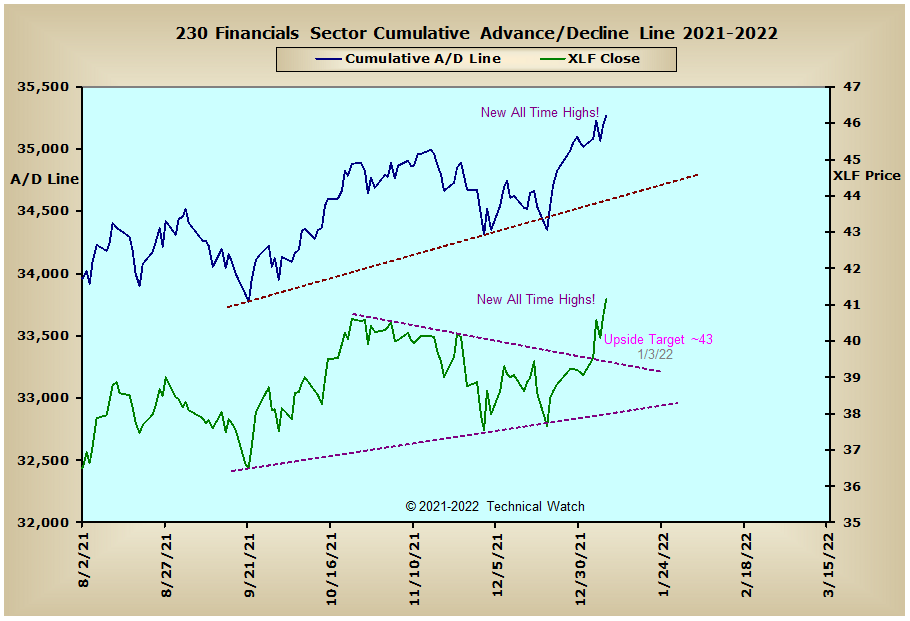
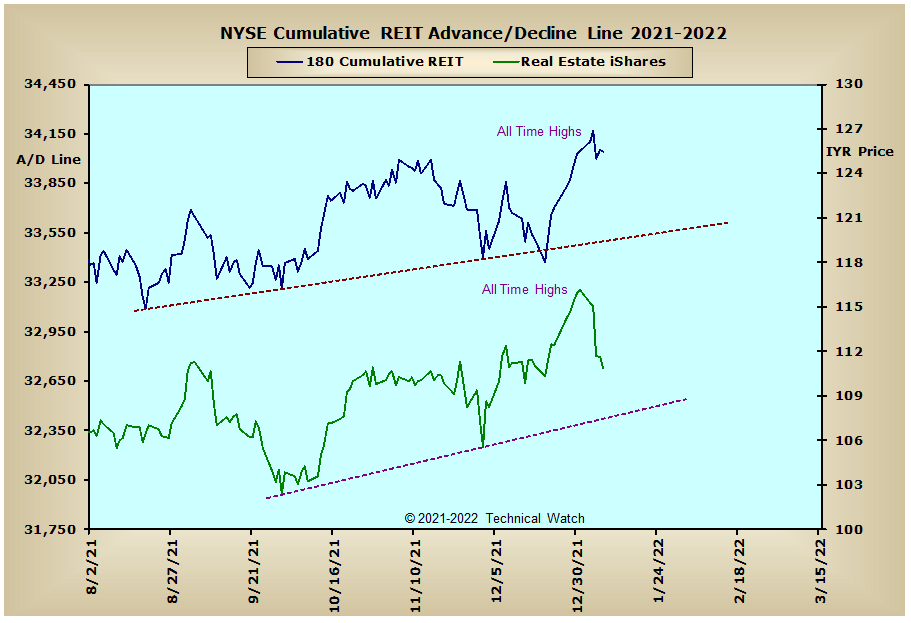
Looking over this week's array of cumulative breadth charts shows that both the NYSE Composite and Common Only advance/decline lines continue to show longer term "trend divergence", while the Russell "2051" advance/decline line maintains the set up for a potential Sign Of the Bear pattern structure that has yet to be triggered. More on the SOB pattern and its possible implications can be found at: https://tinyurl.com/yc4h9p3v Meanwhile, the interest rates sensitive areas of the marketplace were hit hard last week as the yield on the 10 year note saw its biggest weekly gain since September of 2019 to its highest levels since January of 2020 at 1.77%. It should also be noted that this is the first time that yields have closed above their 200 day EMA since April of 2019. Also in play here is that the neckline of a longer term inverse head and shoulders pattern was also triggered giving us a new upside target of around 2.80%. Given the information shared with the Fed Watch Tool at the end of Tuesday's chat, there seems to be a reasonable expectation that we'll reach that objective by the end of this year. Meanwhile, and as you might expect, the Precious Metals and XAU advance/decline lines lost ground last week with this same spike in rates, but both didn't finish below their December lows. This might be one of those whispers that suggest that the metals will remain somewhat buoyant for at least the next couple of weeks as traders wait for more Fed policy information to work with.
So with the BETS finishing at zero, investors remain in cash while watching the action. With the glaring exception of both the NASDAQ and NDX, the rest of the breadth McClellan Oscillators continue to be in positive territory even with last Wednesday's hard price reversal. We'll also note that the NYSE Composite breadth MCO had another end of week small point change on Friday, so let's expect a dramatic move in the major market averages as we begin the week ahead. Let's also note that the volume MCO's echo these same near term compression points that will likely be released over the next several sessions as well. Both the NYSE and NASDAQ Open 10 TRIN's are now neutral at best, while put/call ratios, along with their implied volatility, remain stable at this time. The weakest area of the equity markets remains with the NASDAQ growth issues, while stocks that provide value continue to attract investment capital as liquidity levels recede. With all this as a backdrop then, let's look for continued choppy, if not volatile, action for the week ahead, while keeping a near term watchful eye on the NASDAQ and NDX to see whether or not they can hold their trading range floors of the last 45 days.
Have a great trading week!
US Interest Rates: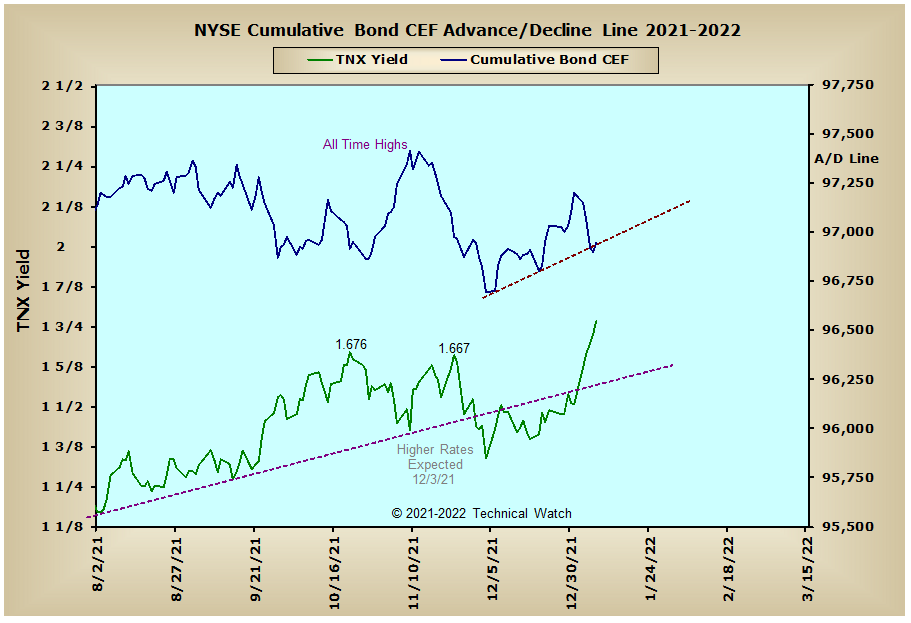

US Sectors: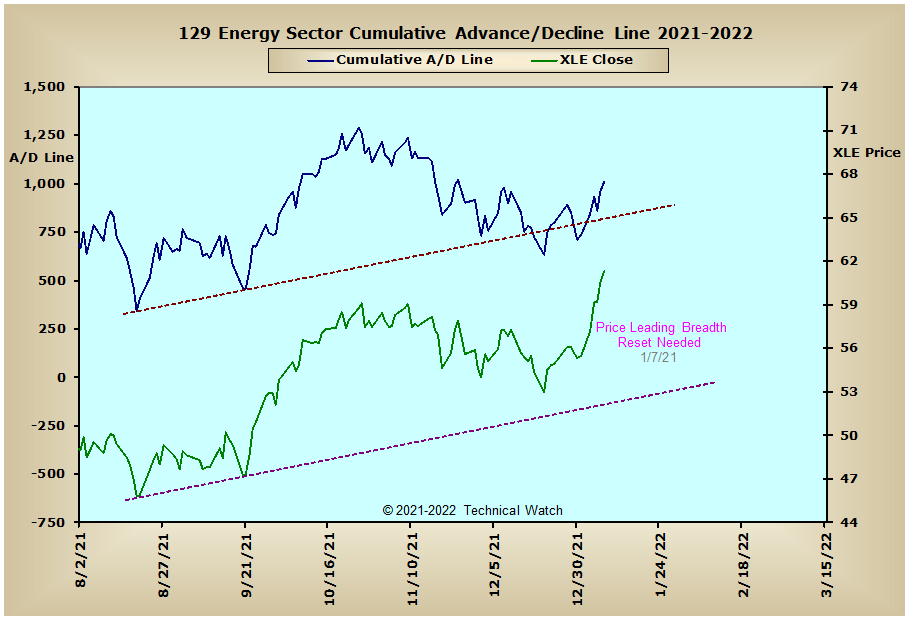
Precious Metals: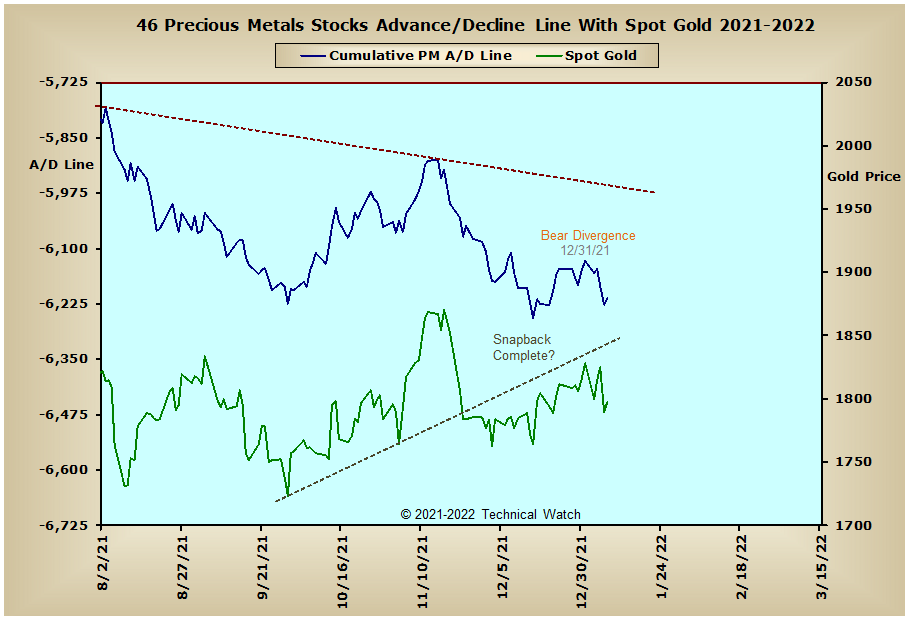

Australia:
England:
France:
Germany:
India:
Edited by fib_1618, 24 January 2022 - 08:27 AM.


