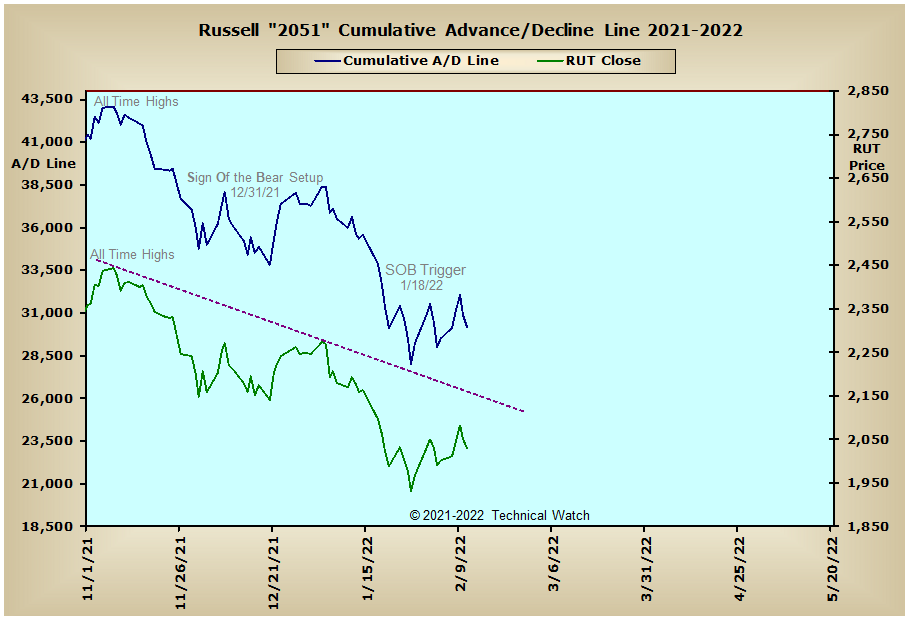
Please note that the time scale has been adjusted this week to provide better analytical insight moving forward.
After rallying into the middle part of the week, the major market indices fell apart on Thursday and Friday to close with only a slight average loss of -.46%, with both the S&P 400 Mid Cap (+1.09%) and S&P 600 Small Cap (+1.38%) Indexes still able to hold on to their early weekly gains as broader based market internals continue to weaken significantly.
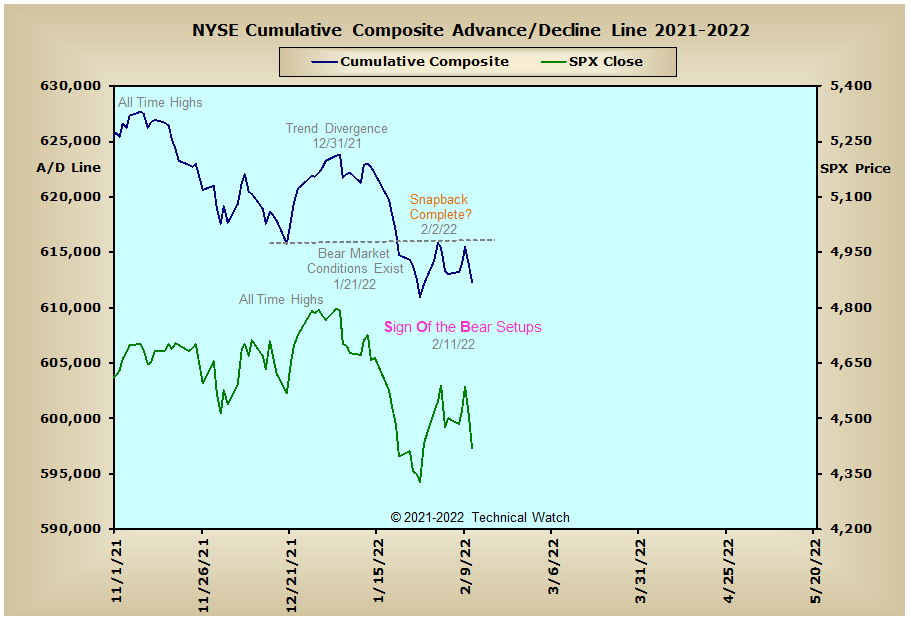
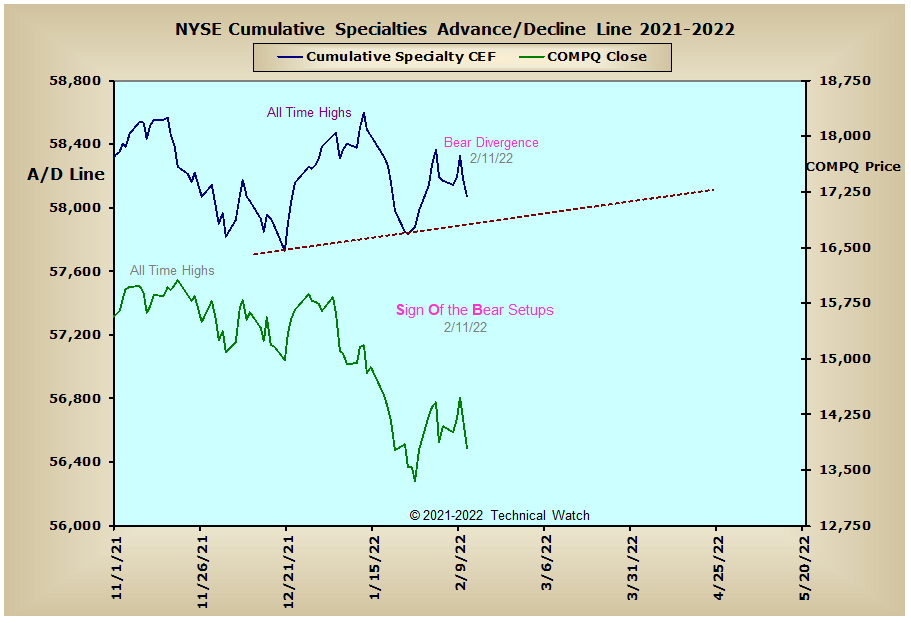
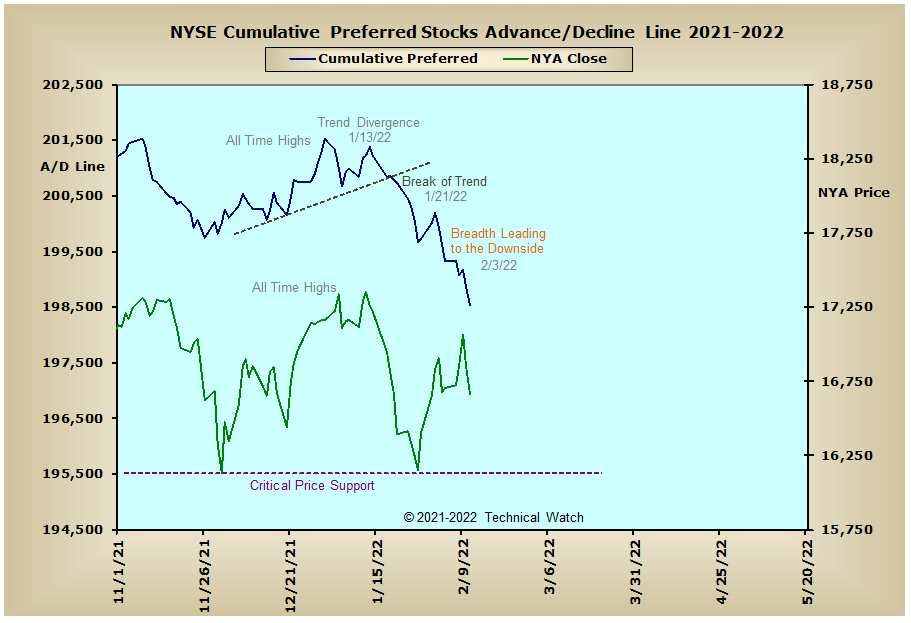
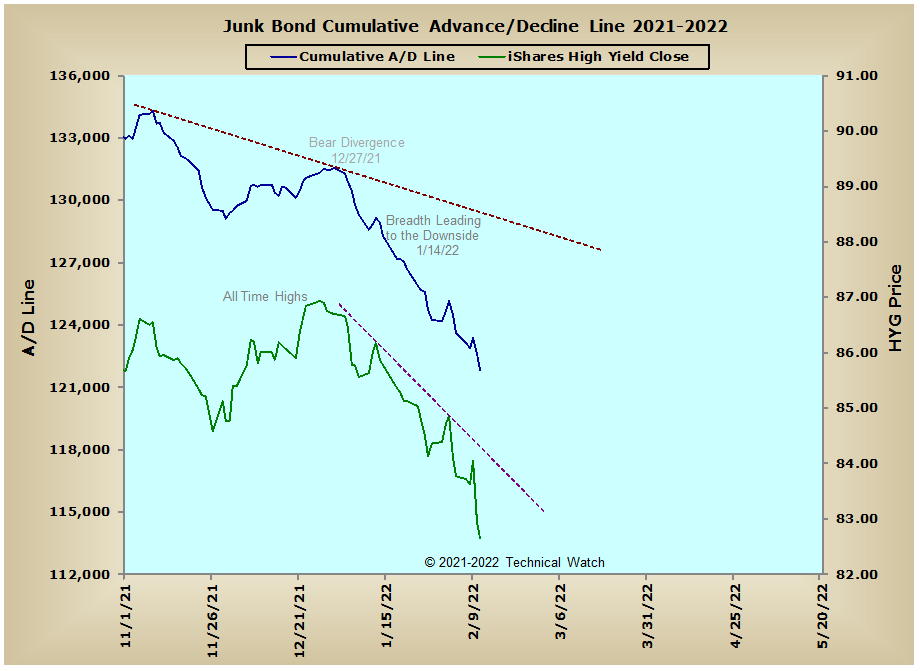
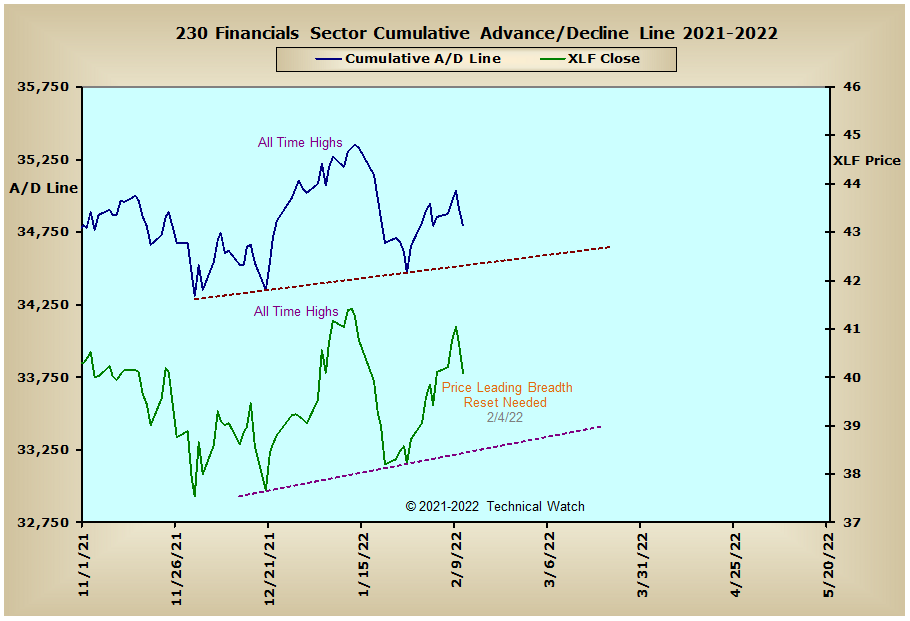
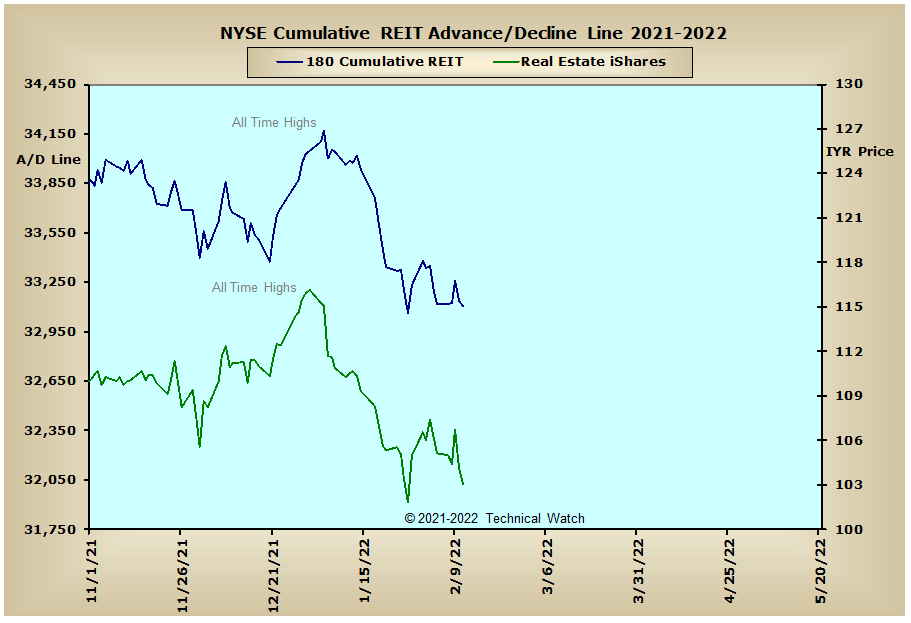
Looking over this week's edition of cumulative breadth charts shows new Sign Of the Bear developments in both the NYSE Composite and NYSE Specialty CEF advance/decline lines along with the price charts of the Dow Jones Industrial Average, S&P 500 and NASDAQ Composite Indexes. Meanwhile, the interest rate sensitive advance/decline lines continue their relentless power dive to the downside as the yield on the 10 year note reached our minimal upside objective of 2% that was given back in the January 4th chat session. After breaking above its 200 week EMA for the first time since the spring of 2019 at the beginning of the year, let's continue to look for prices in the 10 year note to continue lower (yields moving higher) from here to or toward the 3.2% area of longer term resistance from October of 2018.
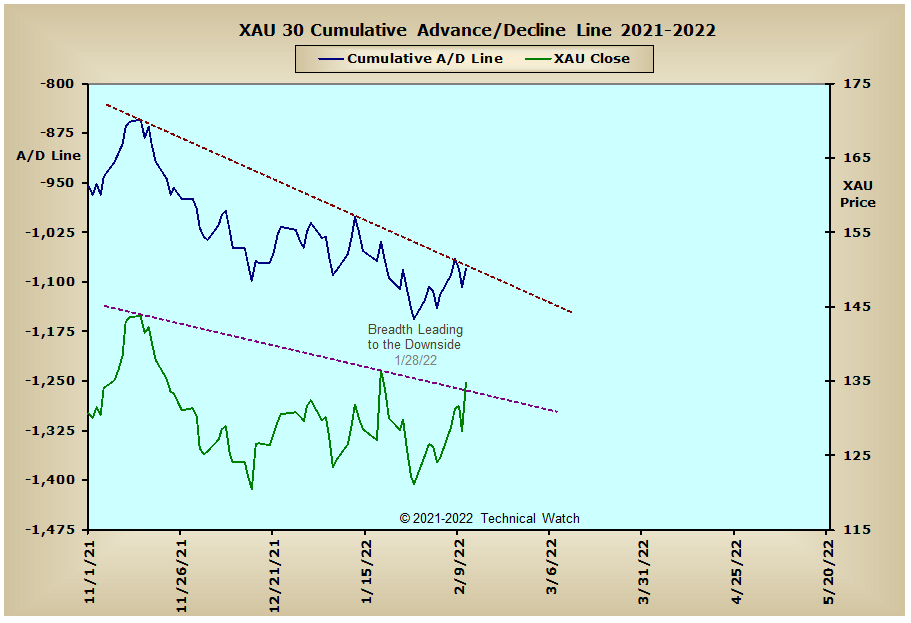
In spite of gold's gain of +1.90% for the week, both the Precious Metals and XAU advance/decline lines remain under the heavy influence of their longer term declining tops lines from their November tops. With liquidity levels continuing to be drained from the financial system here in the Untied States, it's only a matter of when, and not if, prices in the metals reflect this continuing withdrawal of investment capital availability.
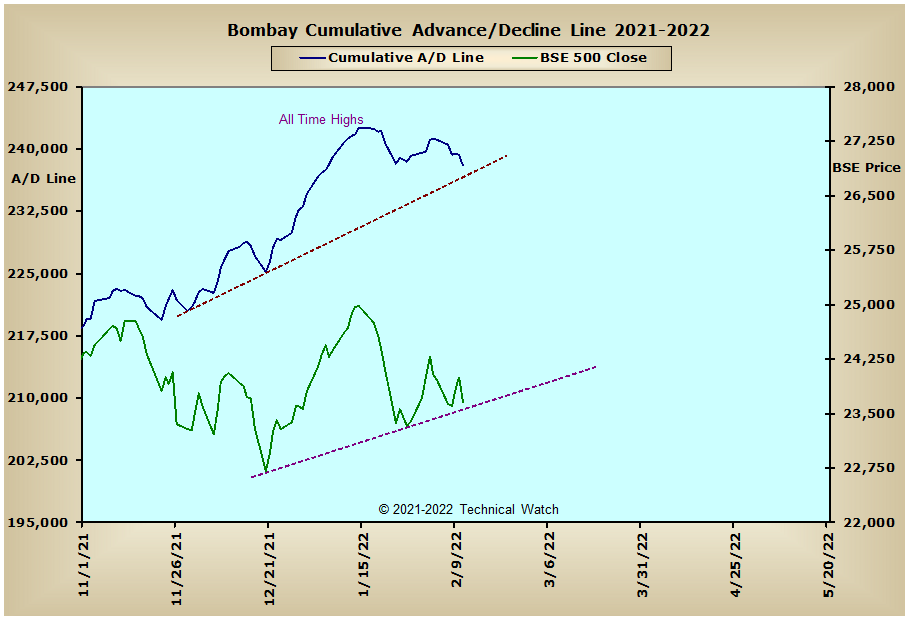
Looking outside of the United States and we see that both the CAC and FTSE advance/decline lines continue to show dissent with the American markets as both made new all time highs this past week, while the DAX advance/decline line maintains its high level consolidation at just below these same historic levels. Meanwhile, the Bombay advance/decline line has now left behind a top beneath a top configuration as it's about to test its longer term rising bottoms line that goes back to late November. Any break below this intermediate term line of support would give a new downside price target for the BSE 500 to around the 19,500 level.
So with the BETS holding steady at -20, investors continue to stand aside waiting for another signal to participate. Both the breadth and volume McClellan Oscillators are now mixed in relation to their zero lines, with the NASDAQ 100, SPX, OEX and DJIA showing the weakest internals at this time. With the SPX breadth McClellan Summation Index having completed a snapback up toward its zero line this past week, along with the OEX and DJIA breadth MCSUM's about to move down and through their respective zero lines, continued follow through price weakness is likely as we start the week ahead. The NYSE Open 10 TRIN starts on Monday near "overbought" levels with a reading of .83, while the NASDAQ Open 10 TRIN is neutral at .89. The 10 day moving average of put/call ratios has now completed a snapback down to what was overhead resistance for nearly 2 years, while implied volatility of put option prices remains elevated at this time. With several new S.O.B structures now in place, along with this month's OPEX finishing out the week, the bears now have an opportunity to make their opinions known in a significant way. With all this in mind then, let's continue to have a bearish bias for the week ahead, with traders continuing to use "hit and run" trading strategies as their main focus unless prices begin to "impulse" to the downside.
Have a great trading week!
US Interest Rates: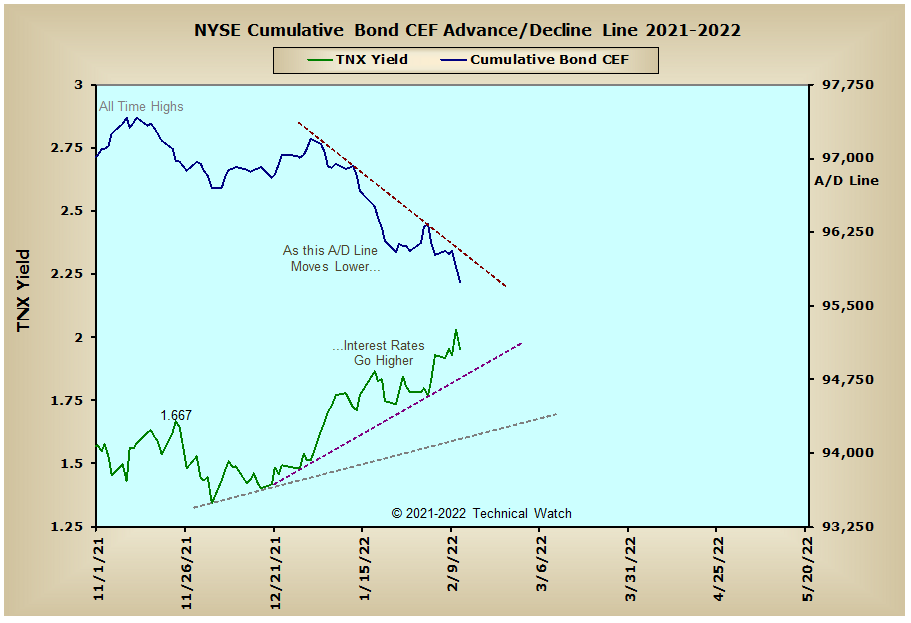
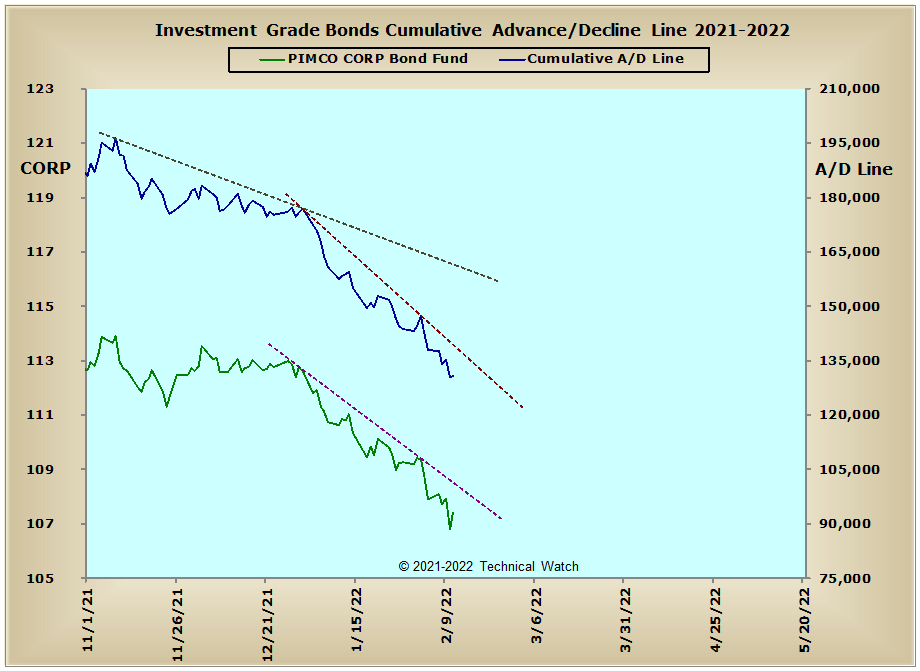
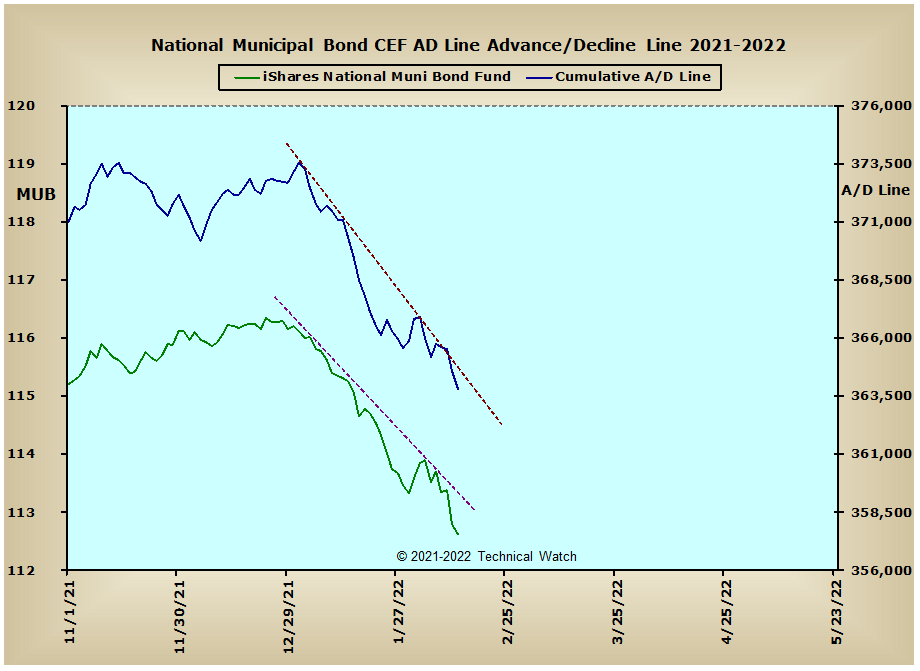
US Sectors:
Precious Metals: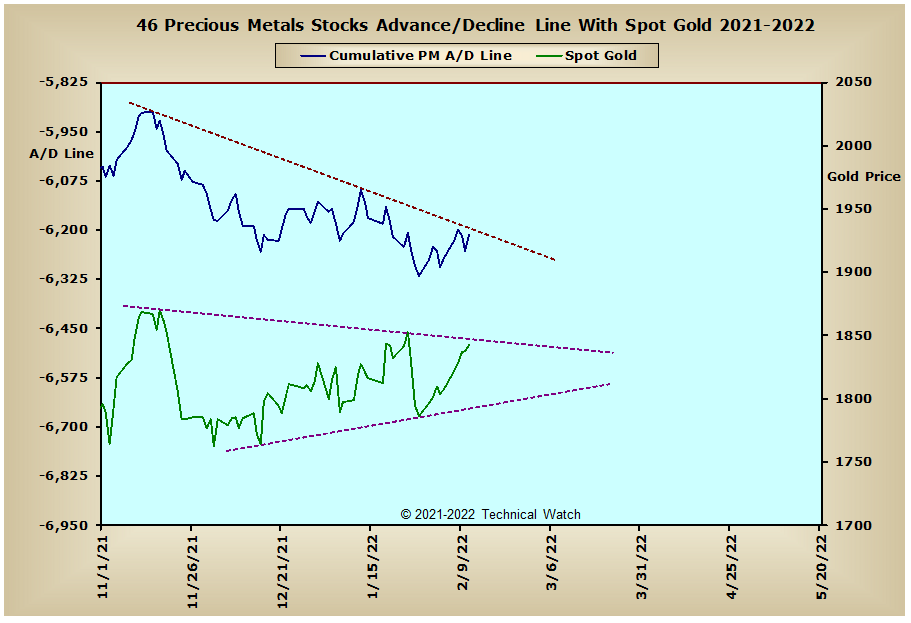
Australia: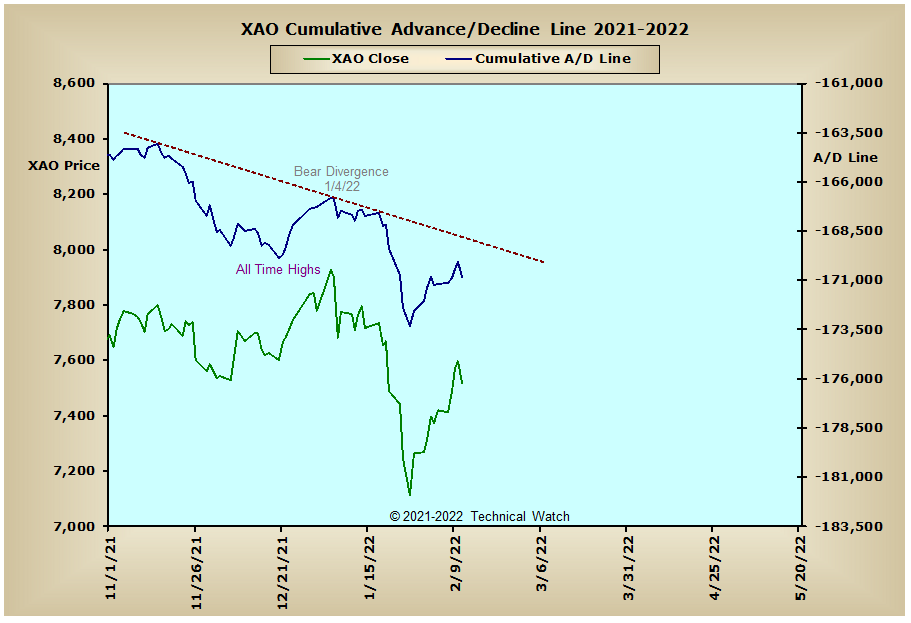
England: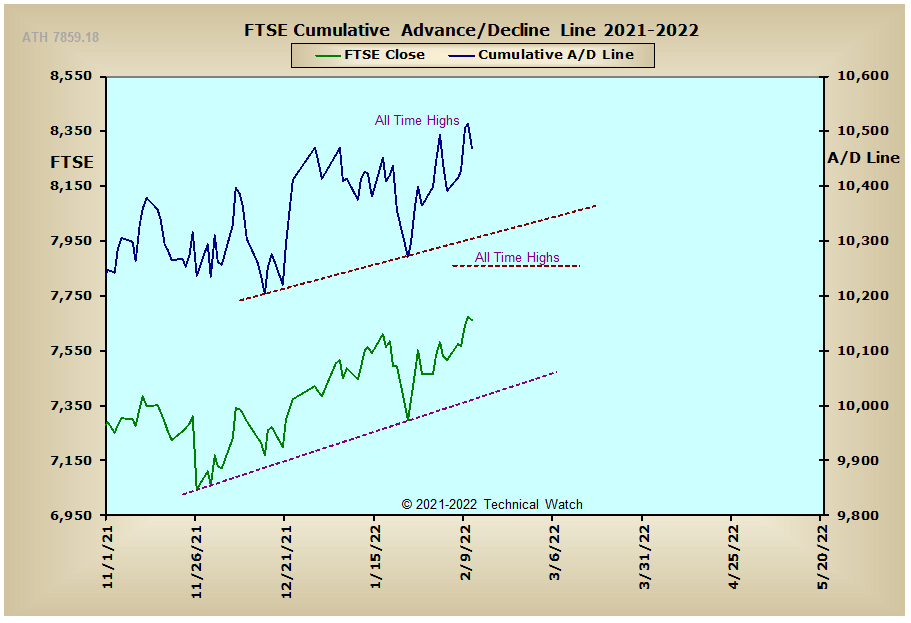
France: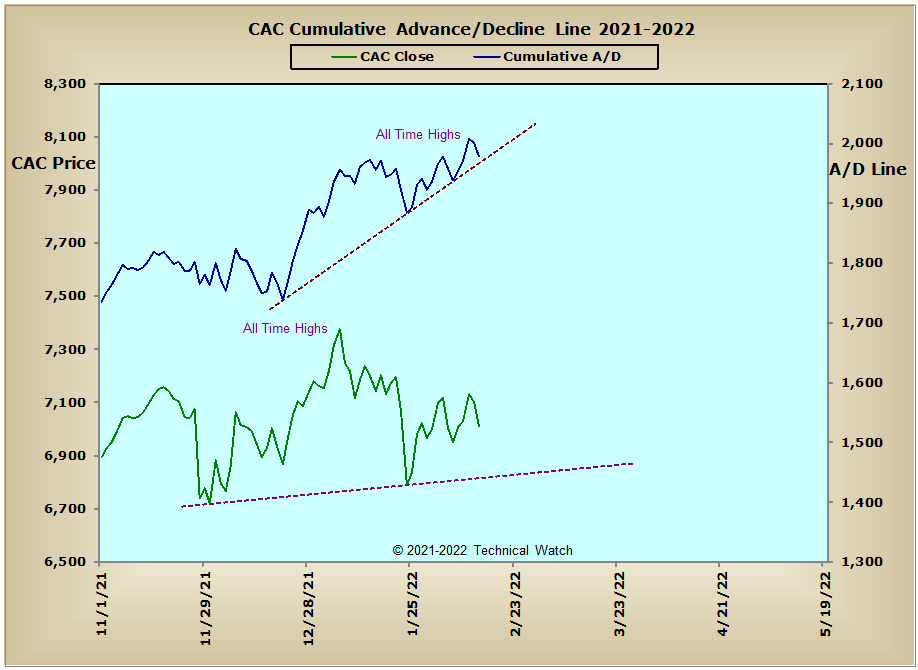
Germany: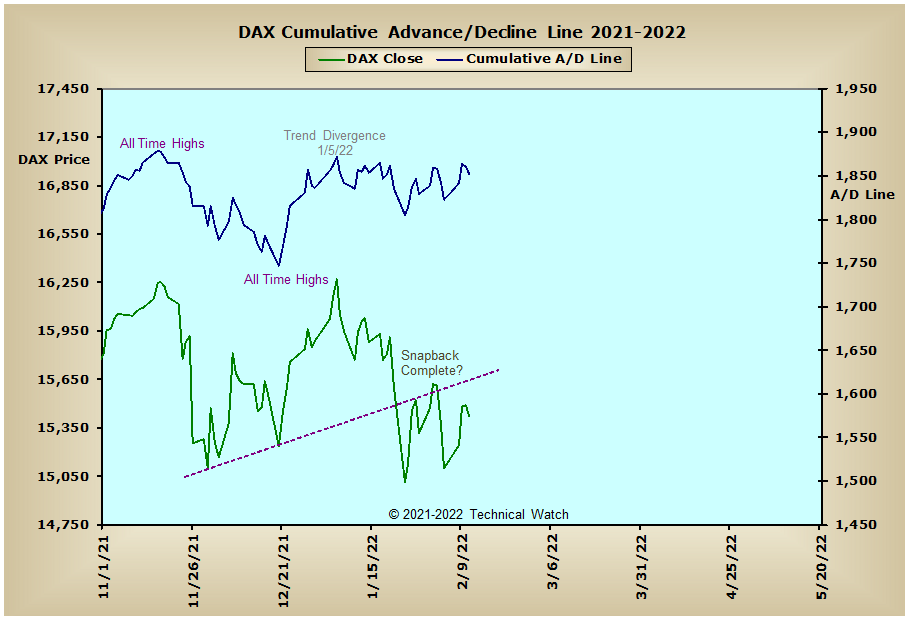
India: