With the threat of a Russian military invasion into the Ukraine driving prices lower into Thursday, it turned out to be a wild roller coaster ride for stock prices for the week as the major market indexes finished with an average gain of +.69%, with the highly "oversold" relief rally on Friday snapping prices back up to or toward their respective 200 day EMA's of longer term resistance.
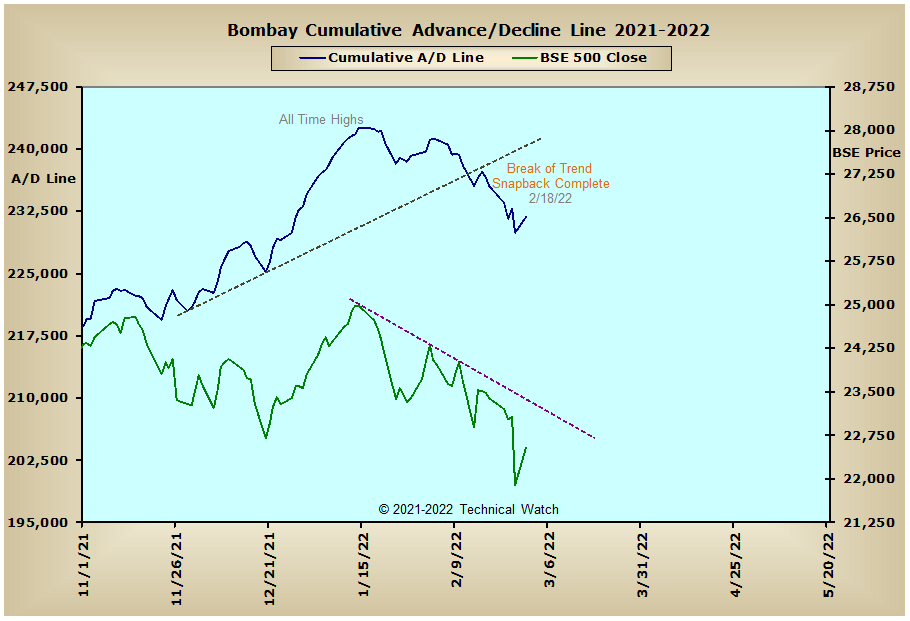
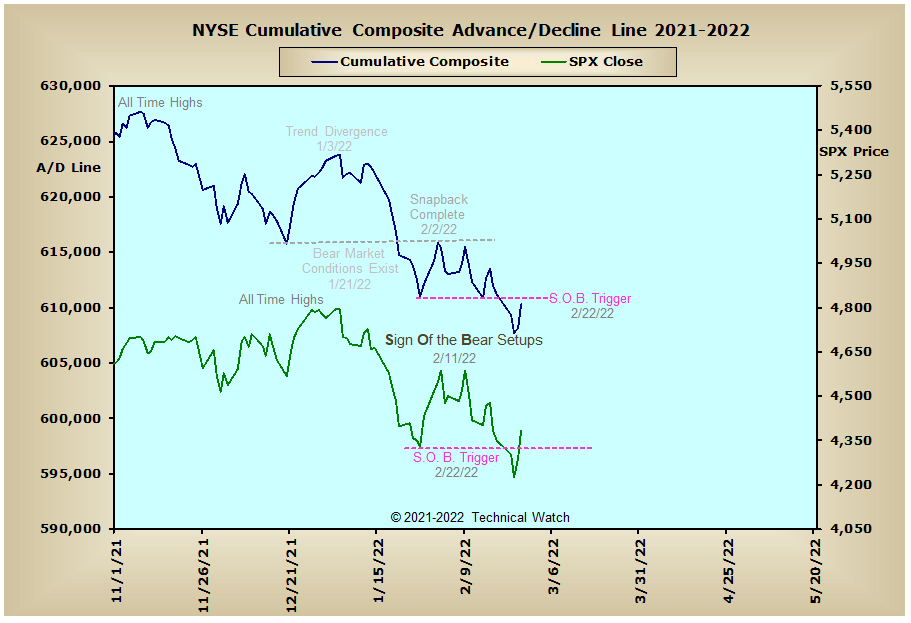
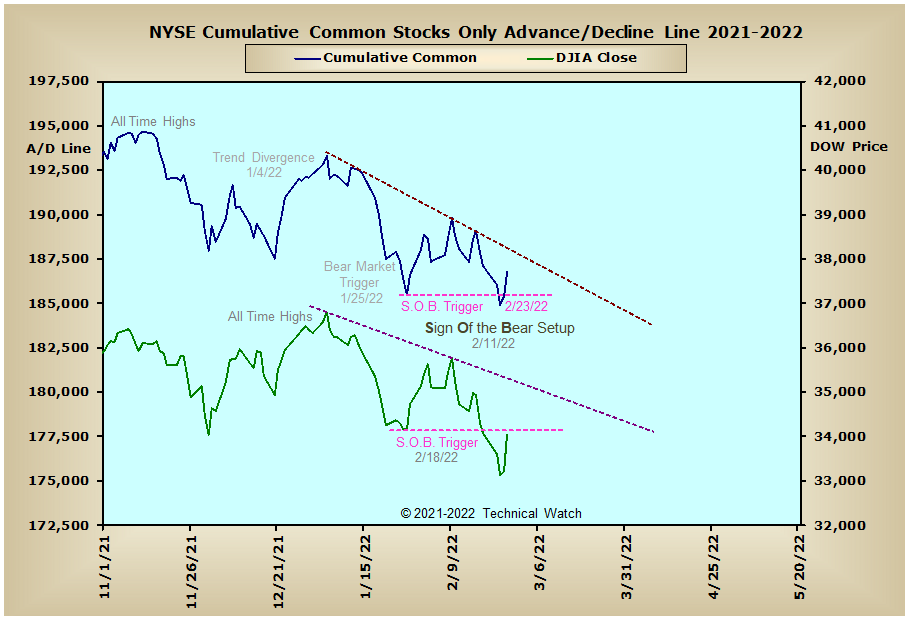
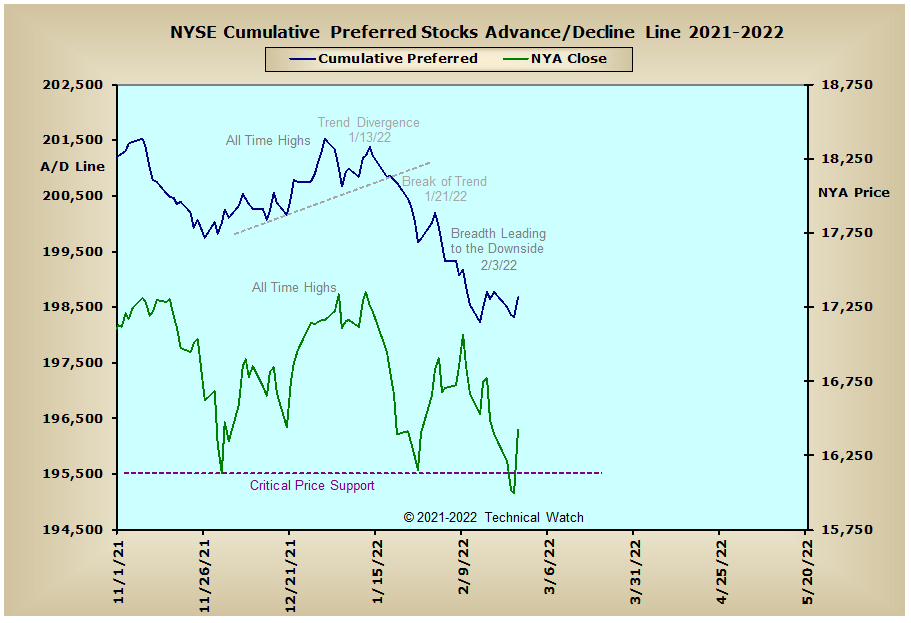
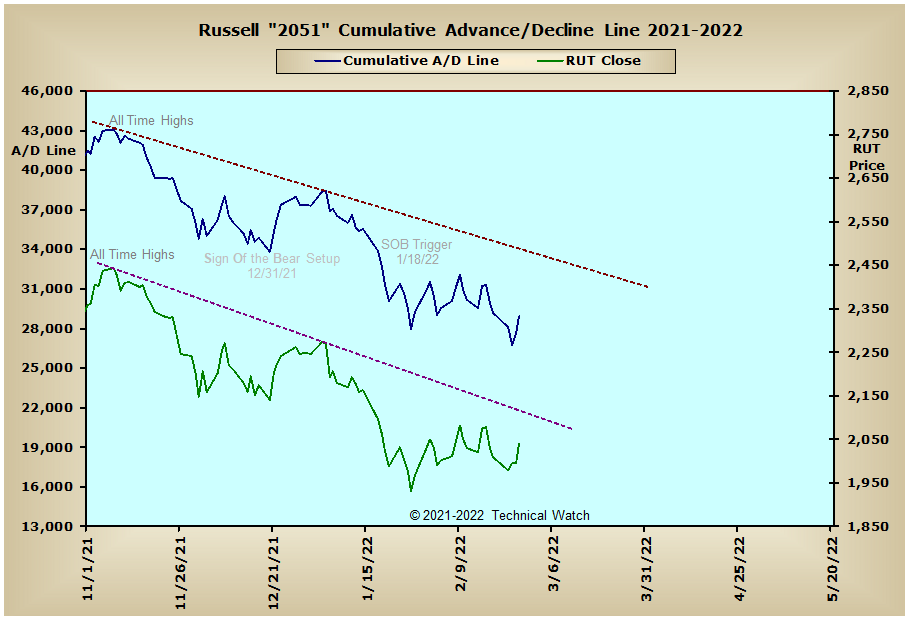
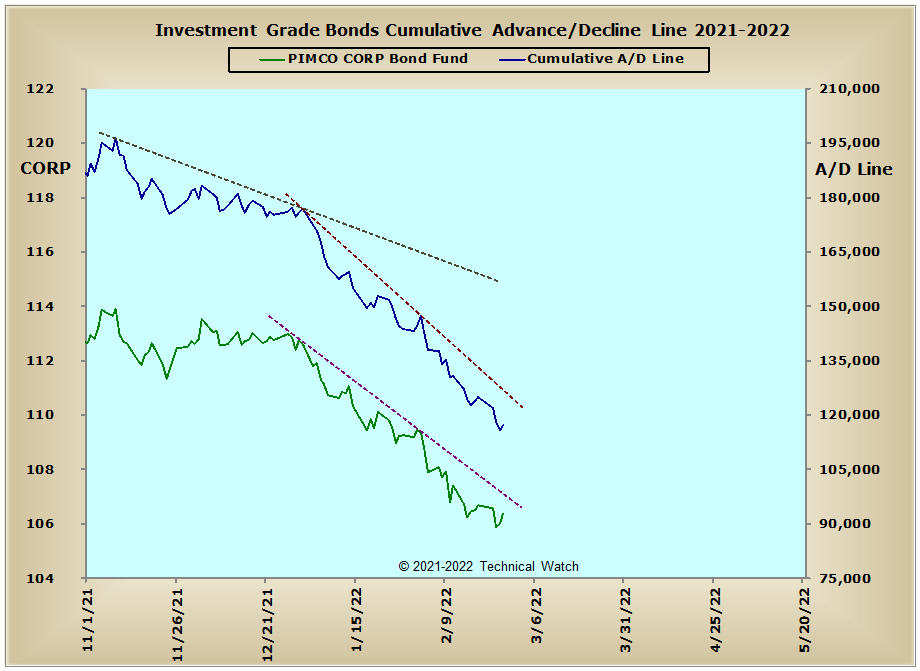
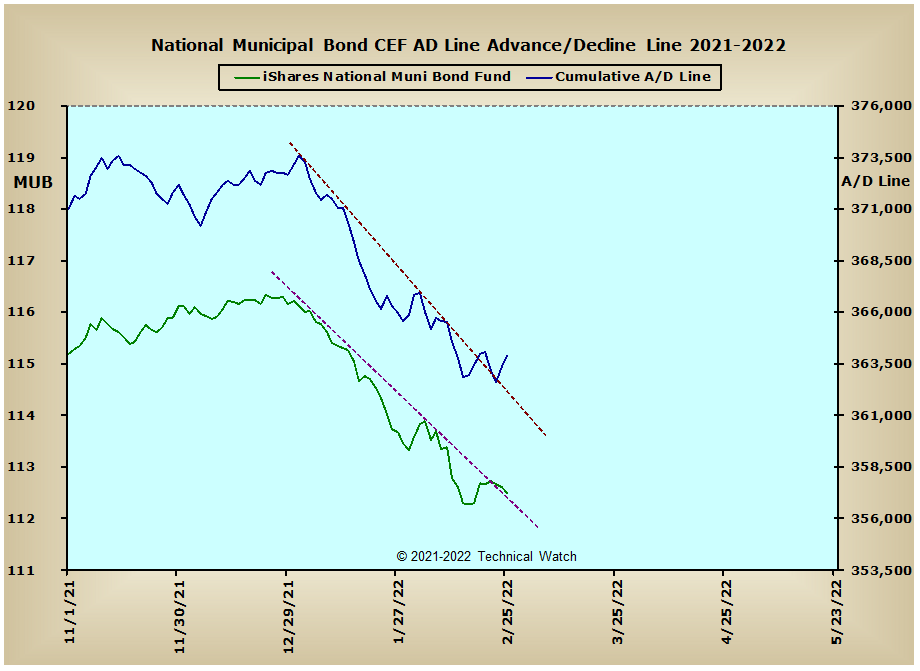
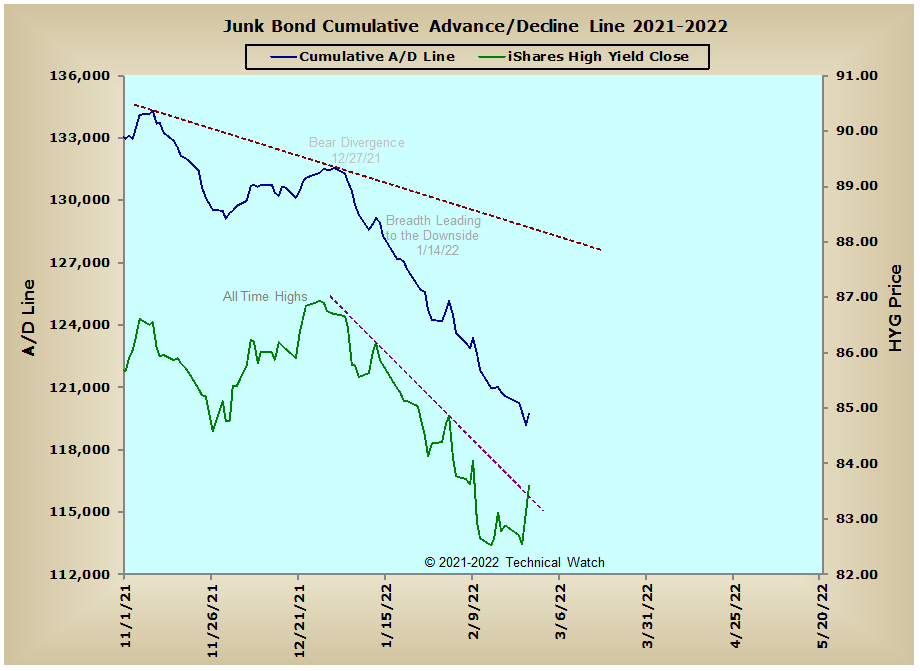
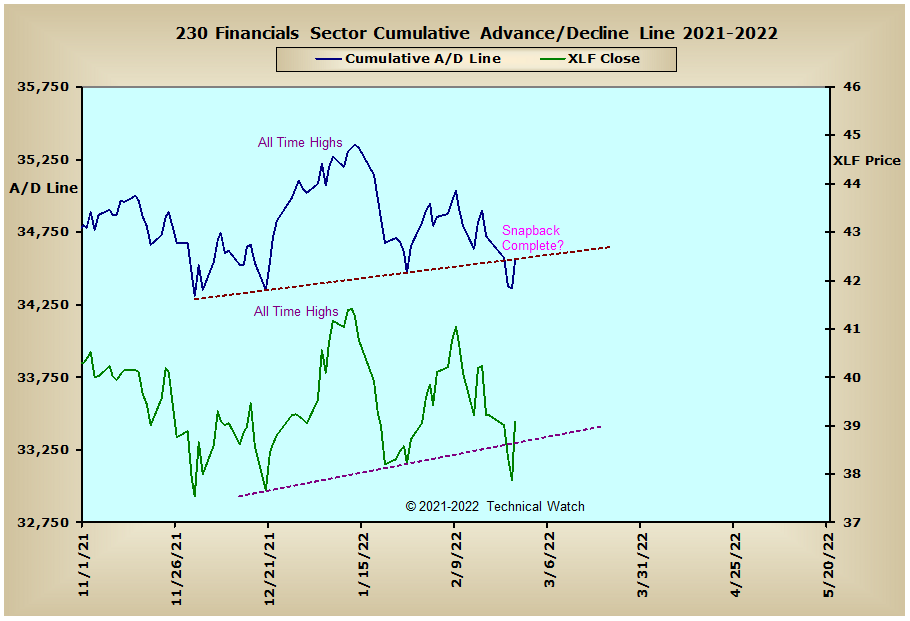
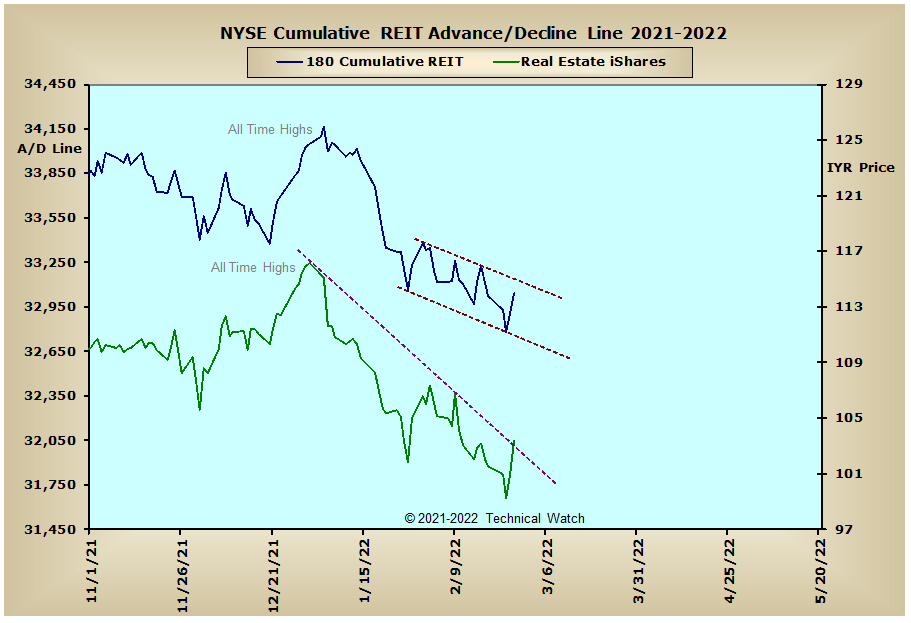
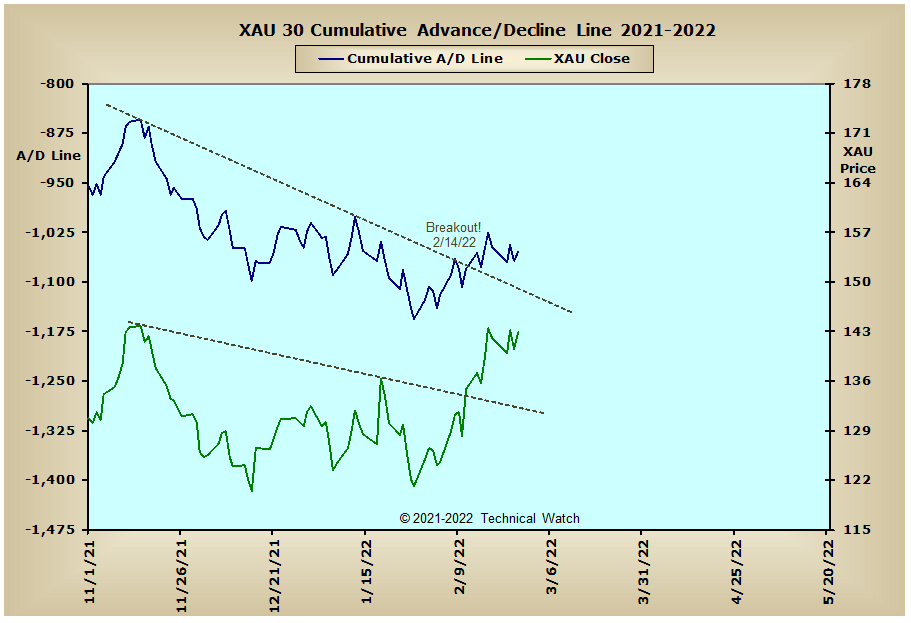
With all of our cumulative charts now updated, we see that all of the Sign Of the Bear price pattern structures that were noted back with the February 11th review were triggered just after the 3 day holiday here in the United States, with only the NYSE Composite advance/decline line failing to finish back above this same trigger point with Friday's closing bell. The interest rate sensitive A/D lines continue to be under the heavy influence of their intermediate term declining trendlines lines at this time, and this continues to put heavy downside pressure on the Russell "2058" advance/decline line due to the future higher costs of working capital. This same expectation of higher interest rates is also putting a cap on both the Precious Metals and XAU advance/decline lines which continue to struggle in trying to find investment capital sponsorship in spite of the price of gold (+5.08%) and silver (+7.25%) gaining for the month. With high volume reversals noted in all of the precious metals price charts last week, further upside progress in this asset class will likely be limited as we go into the month of March. Not surprisingly, international issues continued to show weakness last week as those closest to the military action felt the heavier downside pressure.
So with the BETS moving higher to a reading of -30, traders and investors should scale back to a more moderate bearish outlook. Friday's relief rally allowed all of the breadth and volume McClellan Oscillators to snapback up to (and in some cases just beyond) their respective zero lines, while none of them were able to finish above the important reaction highs of February 15th that would secure a short term price bottom. Both the OEX and Dow breadth MCO's made new flag lows on Wednesday. This also suggests that the bears do have some unfinished business directly ahead in an effort to see an internal floor of extreme in all of the MCO's for a final price capitulation point. All that said, we would be remiss if it wasn't noted that we do have bullish divergent structures working at this time in several of the daily charts that would be triggered on any MCO readings above the same reaction highs of February 15th. The NYSE Open 10 TRIN remains unchanged at 1.06, while the NASDAQ Open 10 TRIN finished on Friday just below neutral at .88. The 10 day average of put/call ratios were quite subdued last week in spite of the sharp market declines into Thursday's lows, and even implied volatility on put options was well contained outside of the Thursday's intraday spike. With the month of March now upon us, along with this being a short term (technical) fork in the road for both sides, let's give the nod to the bearish path of least resistance for the week ahead, while keeping any open shorts on a tight leash just in case the divergences noted earlier are more important than realized.
Have a great trading week!
US Interest Rates: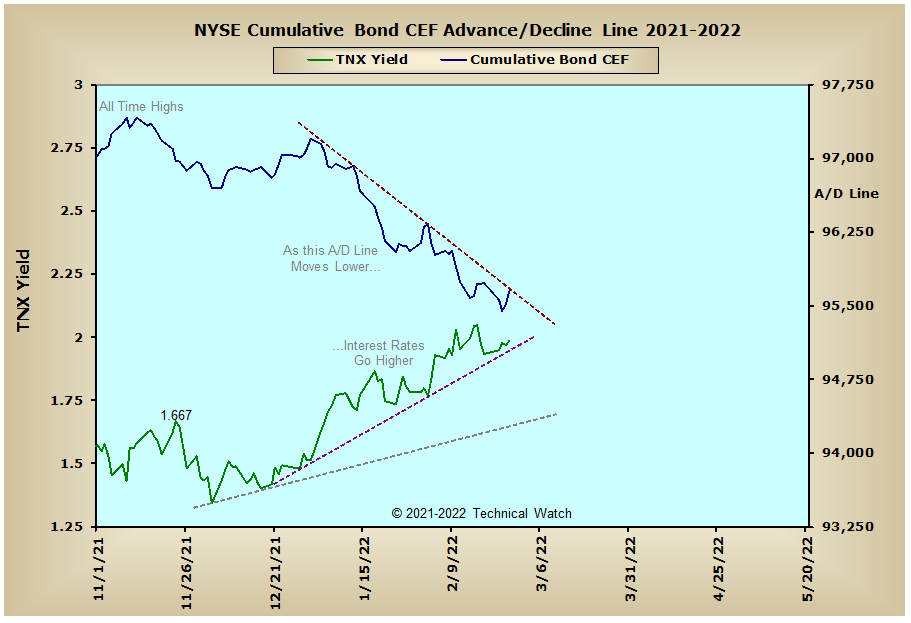
US Sectors: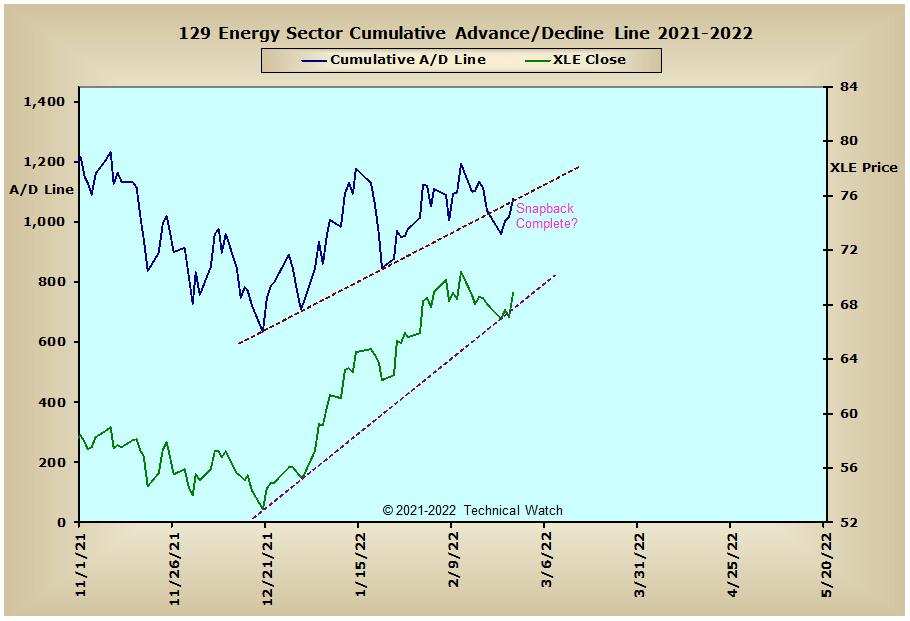
Precious Metals: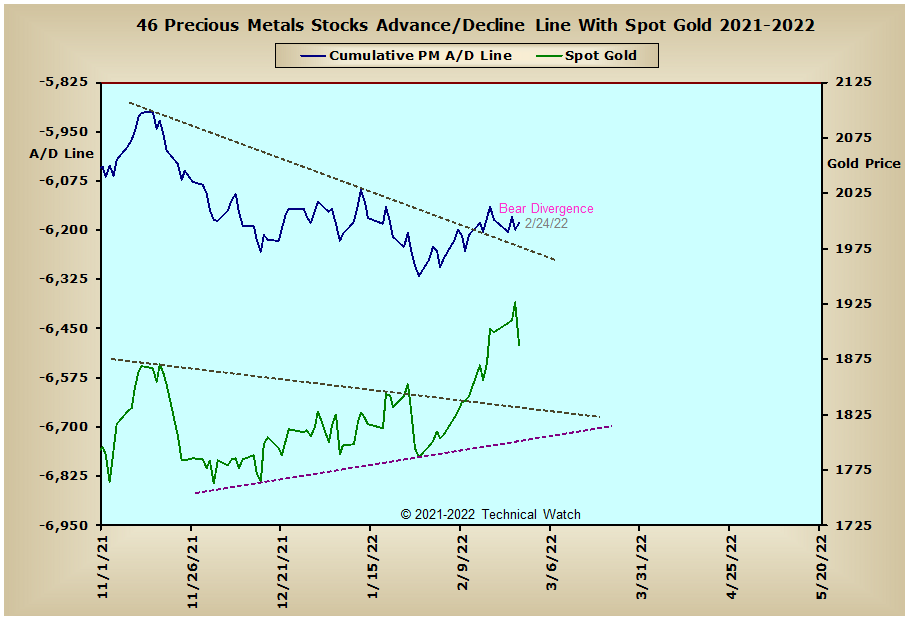
Australia: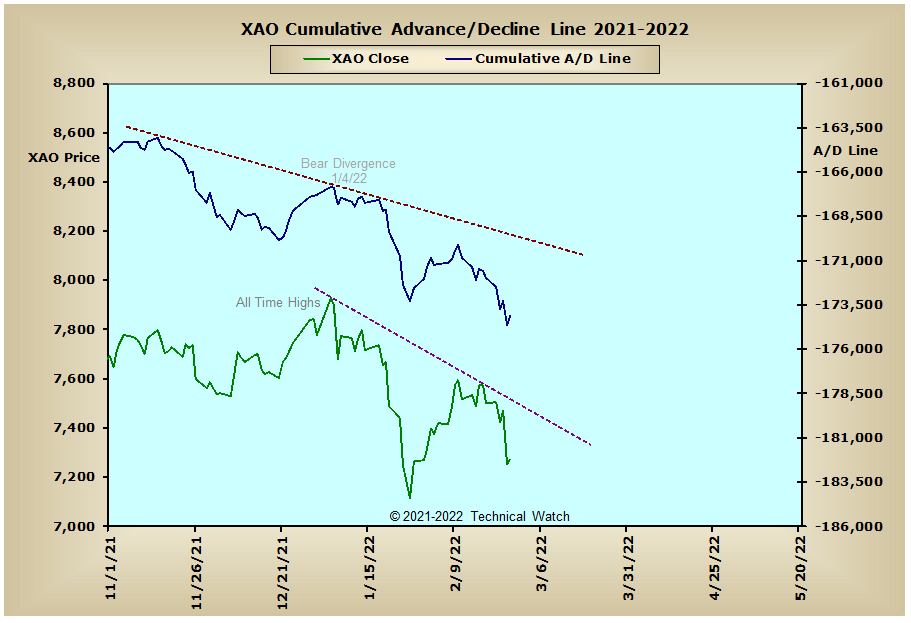
England: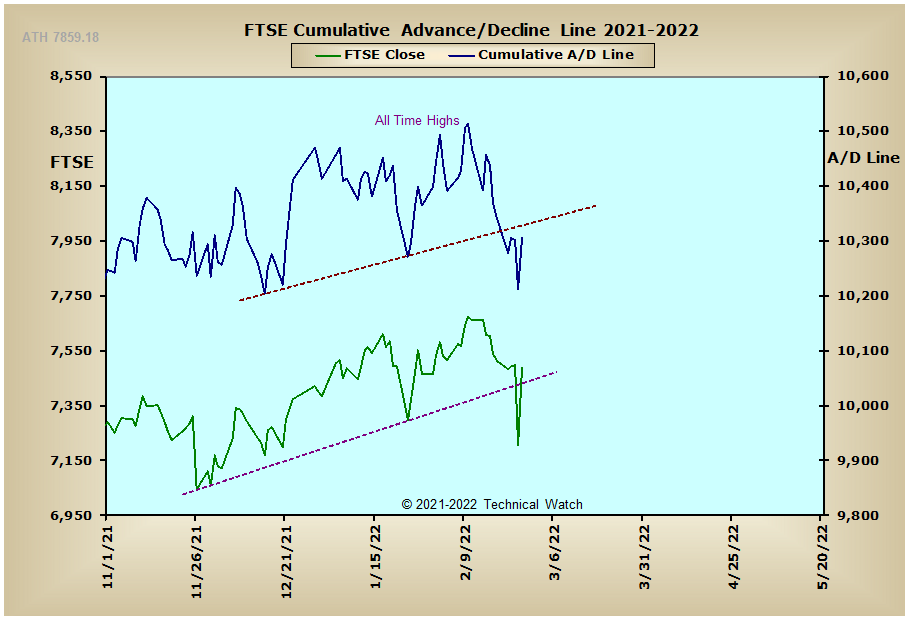
France: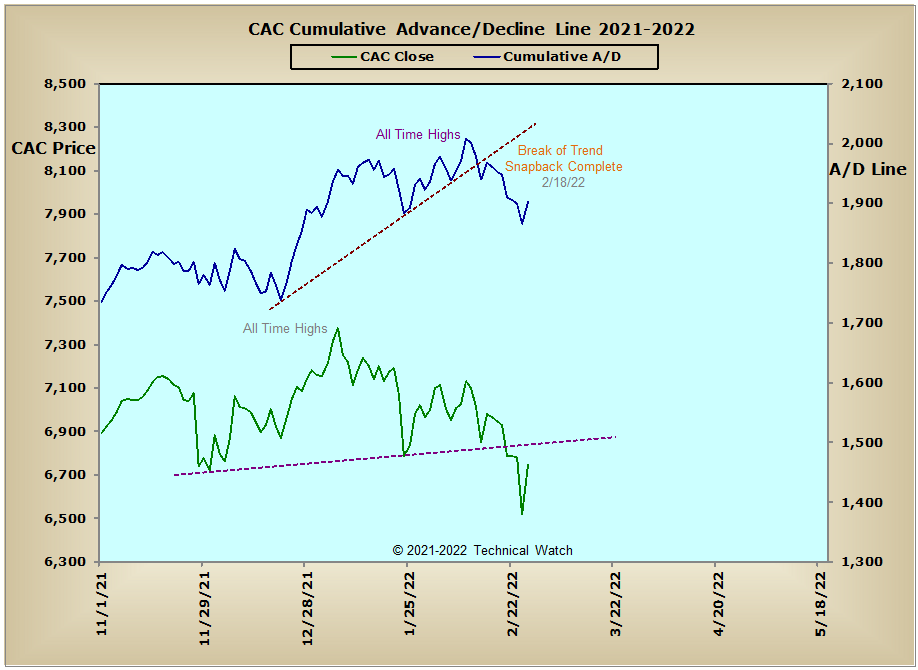
Germany: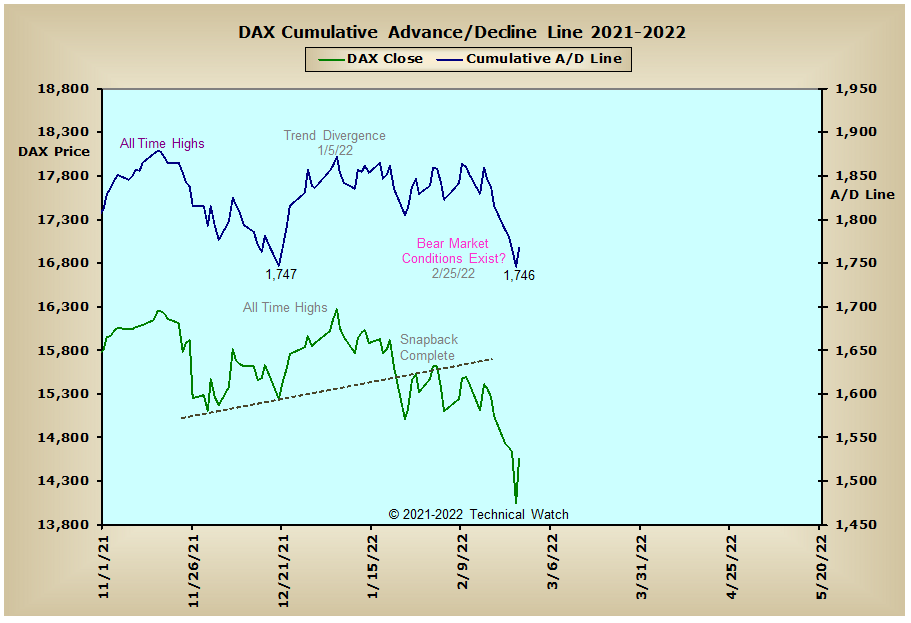
India: