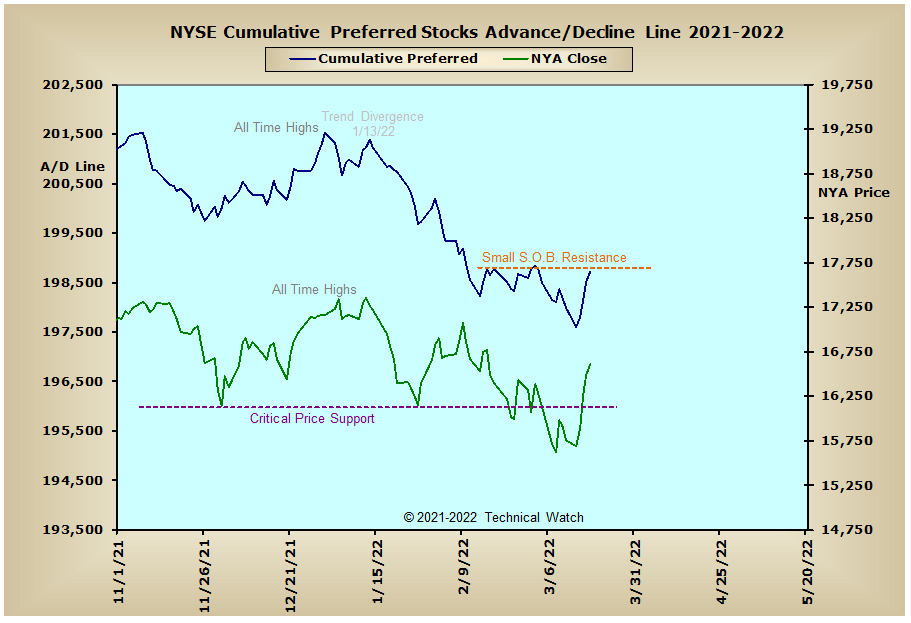
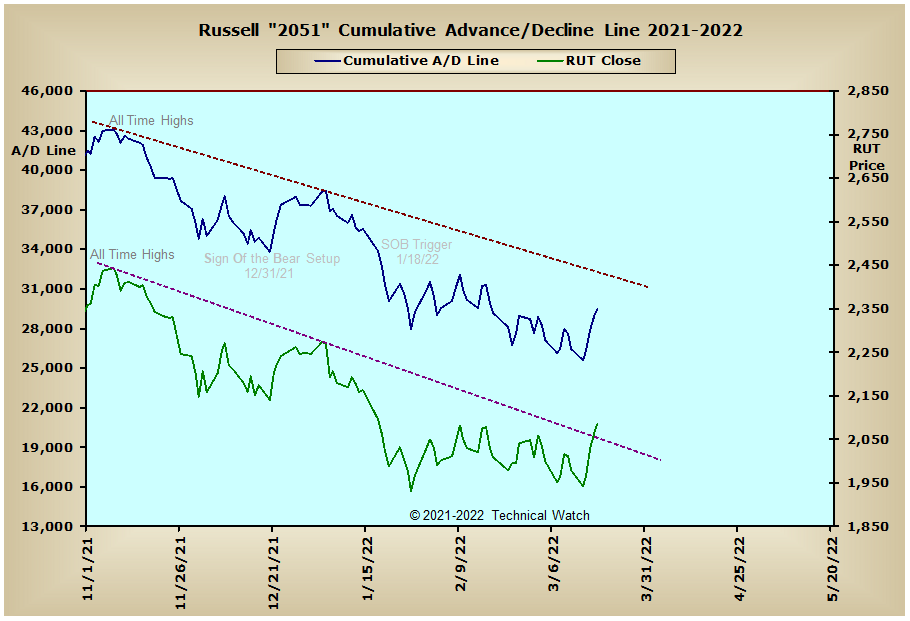
After showing multiple divergent bottoms above bottoms in many of the breadth and volume McClellan Oscillators over the last month, along with a high amount of bearish sentiment over the last two weeks, FED policy clarity on Wednesday was all that was needed for prices to move sharply higher after hitting our SAR sell short triggers just two days before. When all was said and done on OPEX Friday, the major market indexes finished with an average gain of +5.79%. This was the largest weekly gains since November of 2020, with the rally bringing prices back above pre-Ukrainian invasion levels. Leading the pace to the upside was the NASDAQ Composite Index as it added +8.18%, while the S&P 600 Small Cap Index brought up the rear with still a healthy gain of +4.20%.
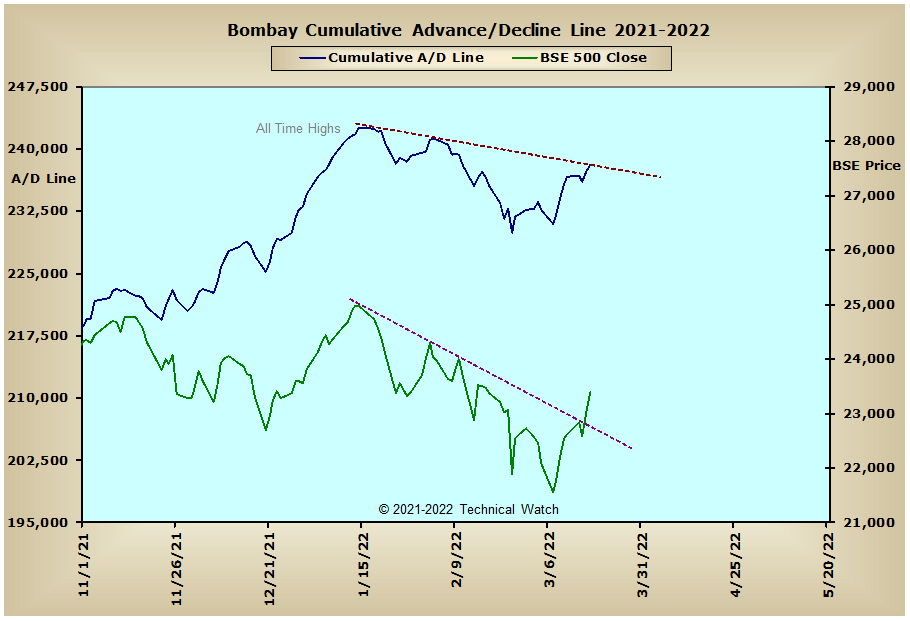
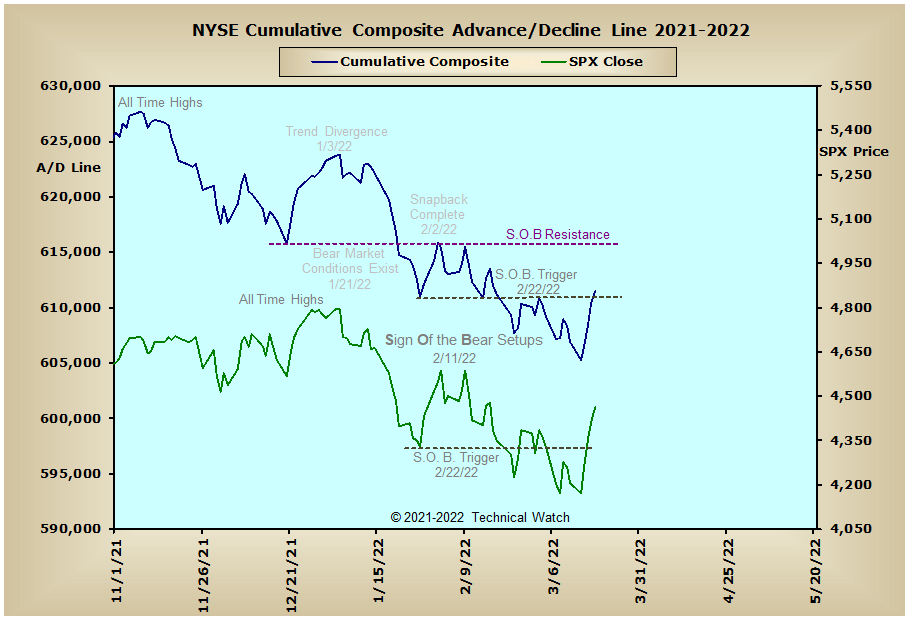
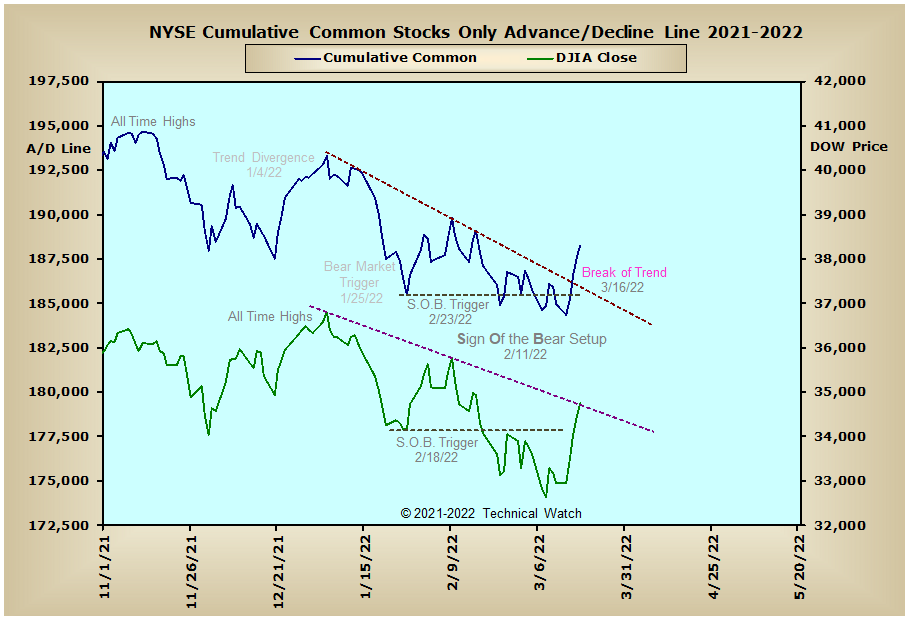
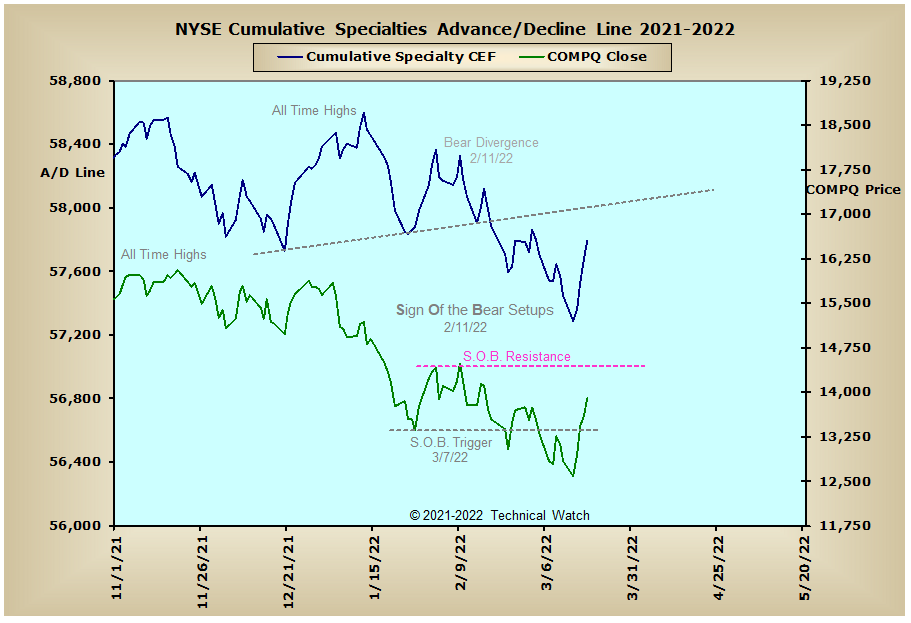
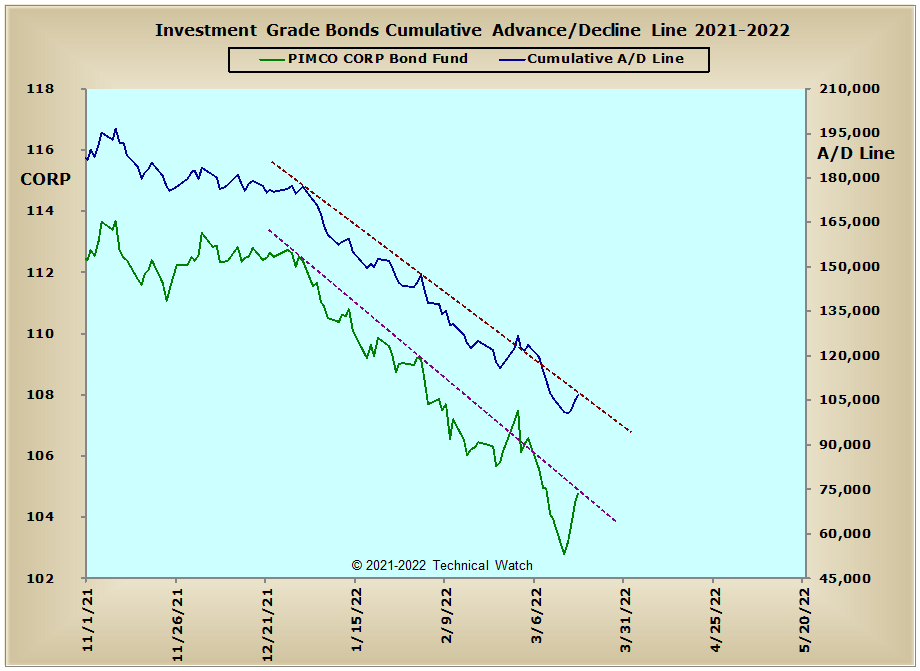
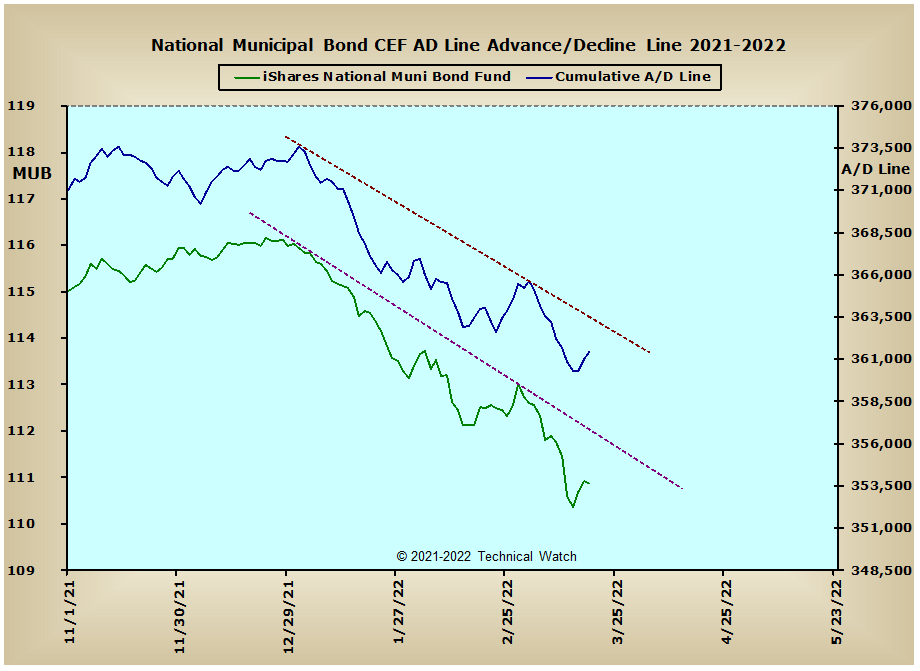
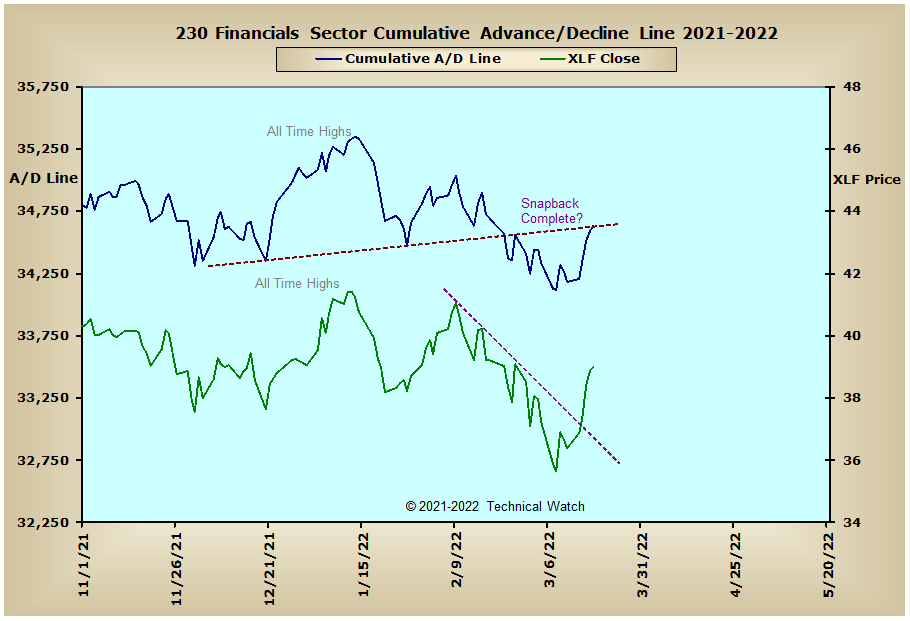
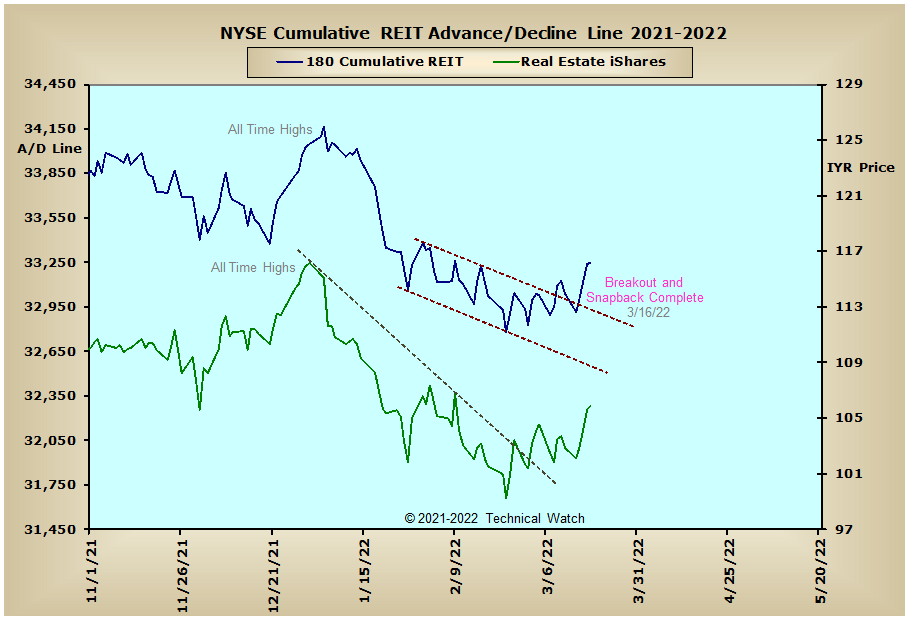
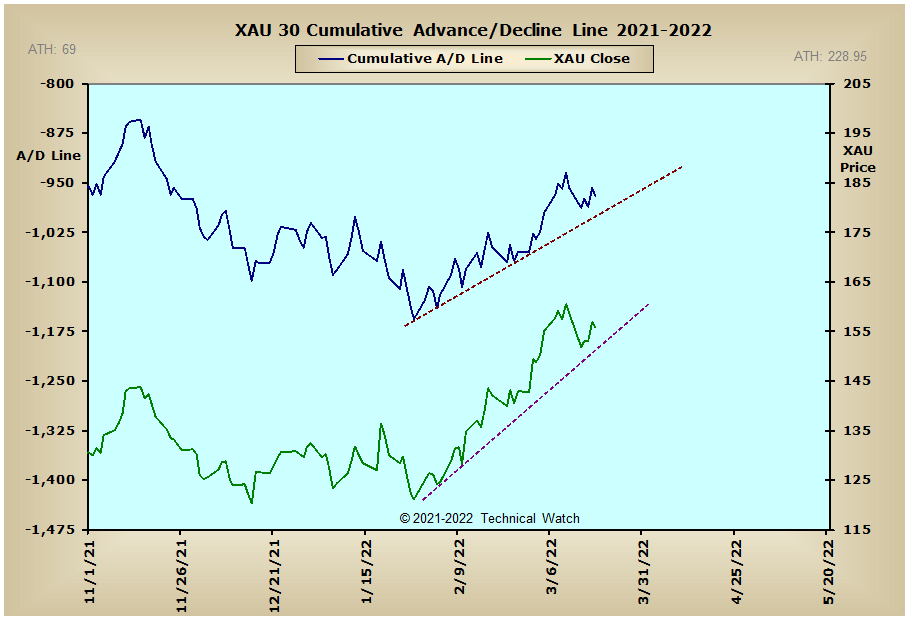
Looking over this week's batch of equity breadth charts shows that many had good cumulative gains of their own, though many remain under the broader influence of their intermediate term declining tops lines that go back to the beginning of the year. The interest rate sensitive areas of the marketplace continue to show broad based selling at this time, while precious metals stocks continue to trend to the upside. European issues also saw a nice rebound from Monday's lows as well, though all of the international markets remain with a negative bias. All in all, we'll work with the initial idea that this was more of a technical rally just as one would release the tension of a rubber band propeller of one of those old balsa wood airplanes and letting it fly.
So with the BETS moving higher again to a reading of +10 after moving to a neutral reading just the week before, investors were able to sidestep most of the damage the shorts were hit with after the FED's Statement. The good news for the buyers is that all of the breadth and volume McClellan Oscillators were back in positive territory on Friday with some at levels not seen since the end of last year. This would support the market forecast from last December that the 1st quarter of 2022 would likely be one of weakness before the next tradable bottom. However, there are some problem areas that still need to be sorted where several of the MCO's have not had crossover component confirmations above their respective zero lines to provide short term buy signals. This, of course, can change quickly with any further strength we might see on Monday into Tuesday, but at this point, last week's ferocious gains has all the markings of a typical "too far and too fast" bear market rally as many of the breadth and volume McClellan Summation Index readings remain in negative territory. Friday's Open 10 TRIN in the NYSE was near "oversold" at .98, while the NASDAQ Open 10 TRIN is currently "overbought" at .71. There continues to be very little movement in the 10 day moving average of both the CBOE and Equity put/call ratios as put option volatility fell off a cliff. Randy Nelson also shared with me that the Options Clearing Corporation (OCC) P/C ratio was "very high" last week, and remained so until Friday where the ratios finally dropped to neutral. With index prices generally finishing above their 200 day EMA's on Friday, let's go ahead and let the dust settle a bit by taking a more neutral stance toward equities for the week ahead, with traders moving back to "hit and run" trading strategies until a definitive market rhythm is reestablished.
Have a great trading week!
US Interest Rates: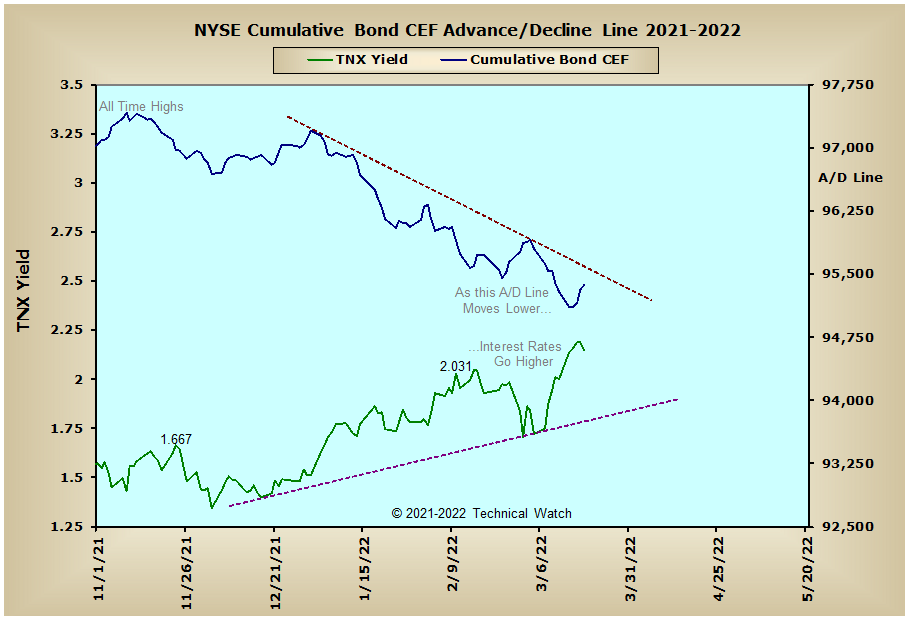

US Sectors: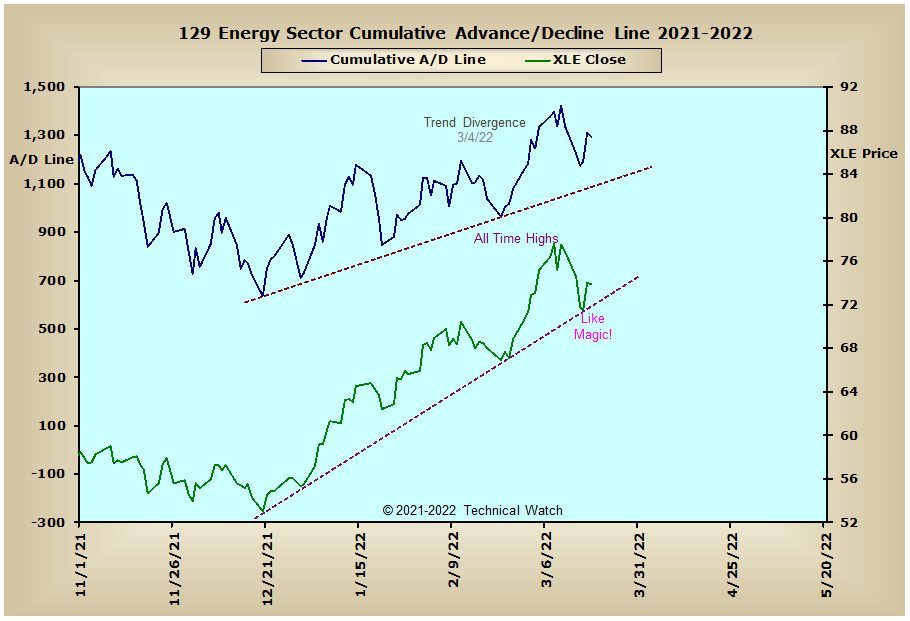
Precious Metals: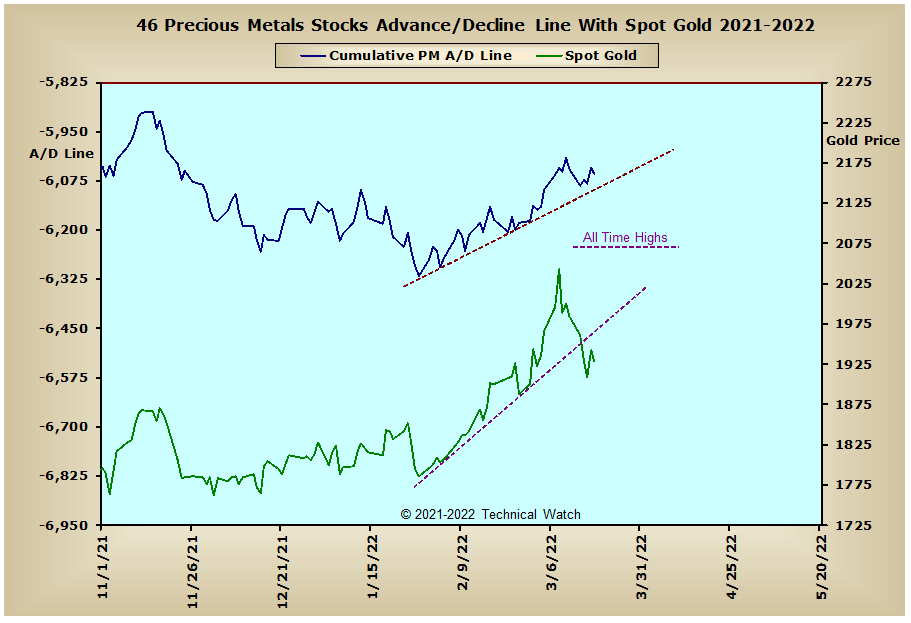
Australia: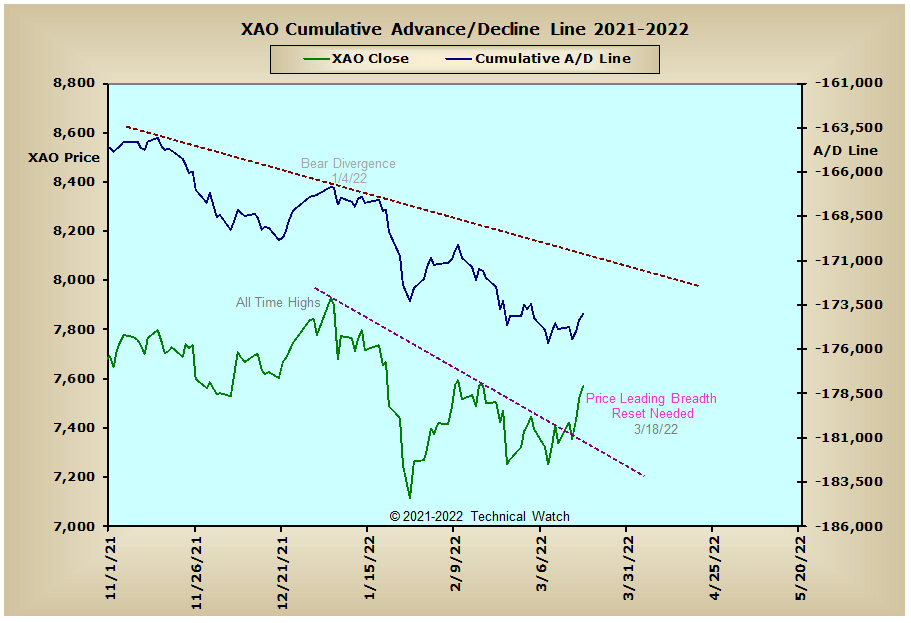
England: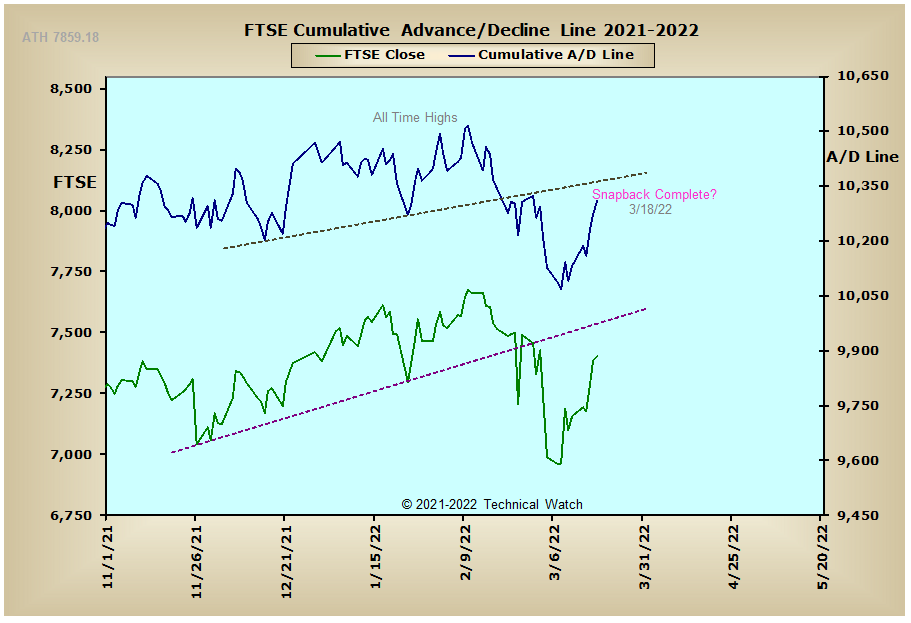
France: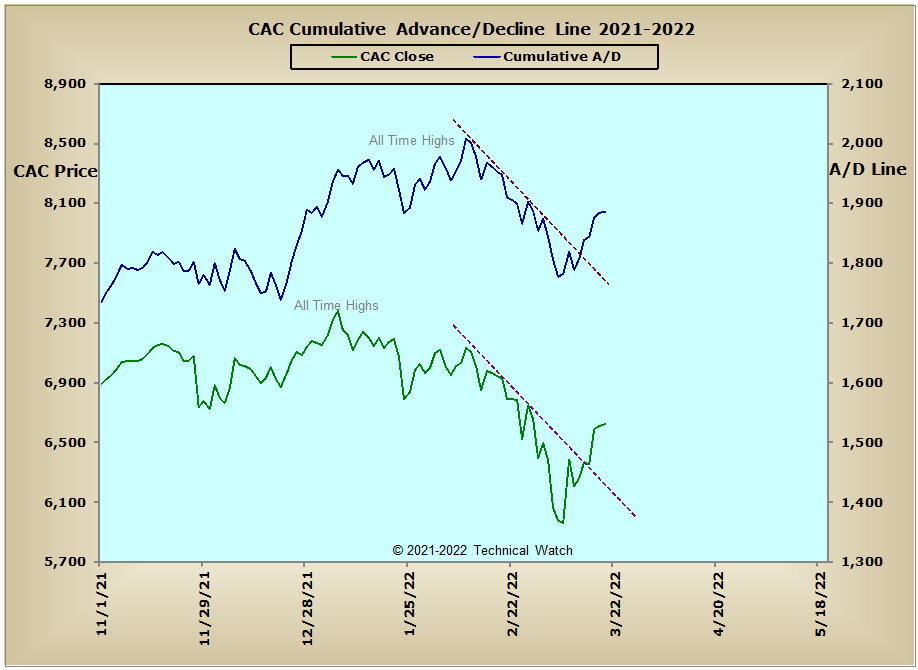
Germany:
India: