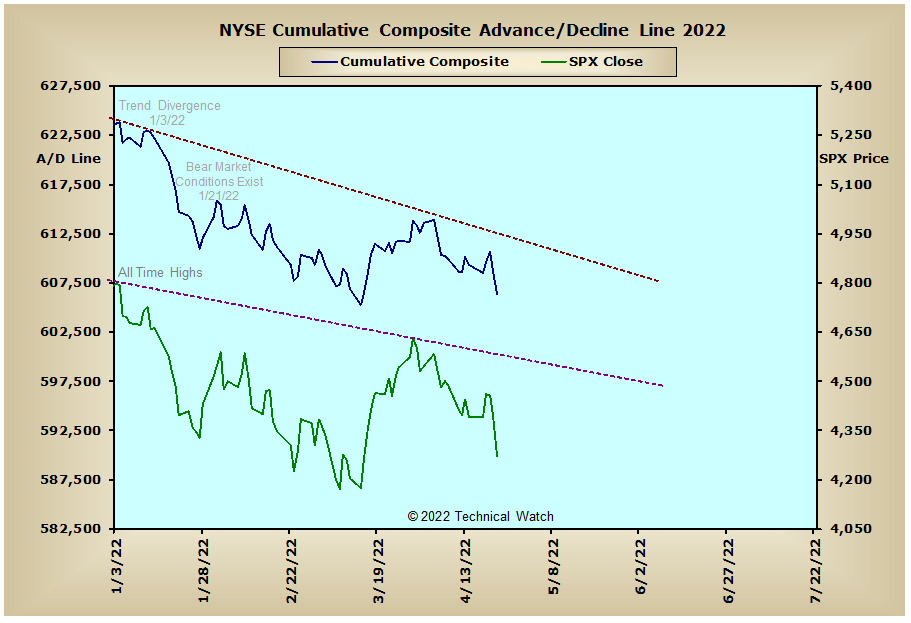
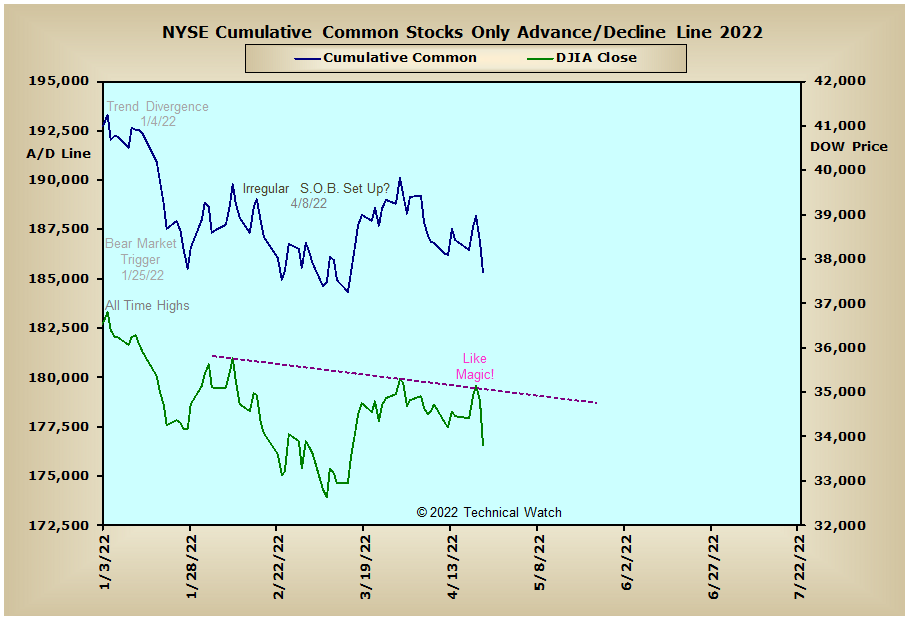
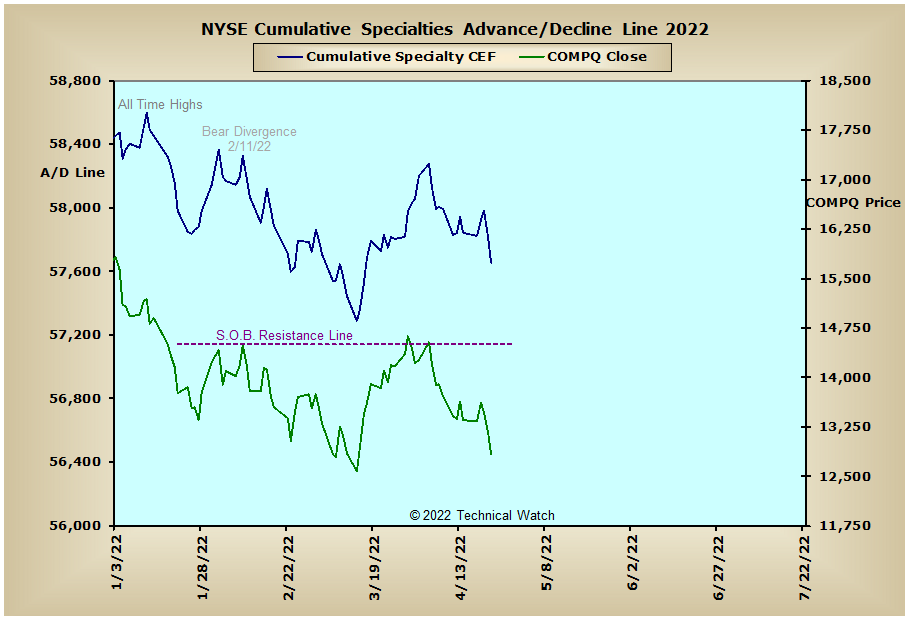
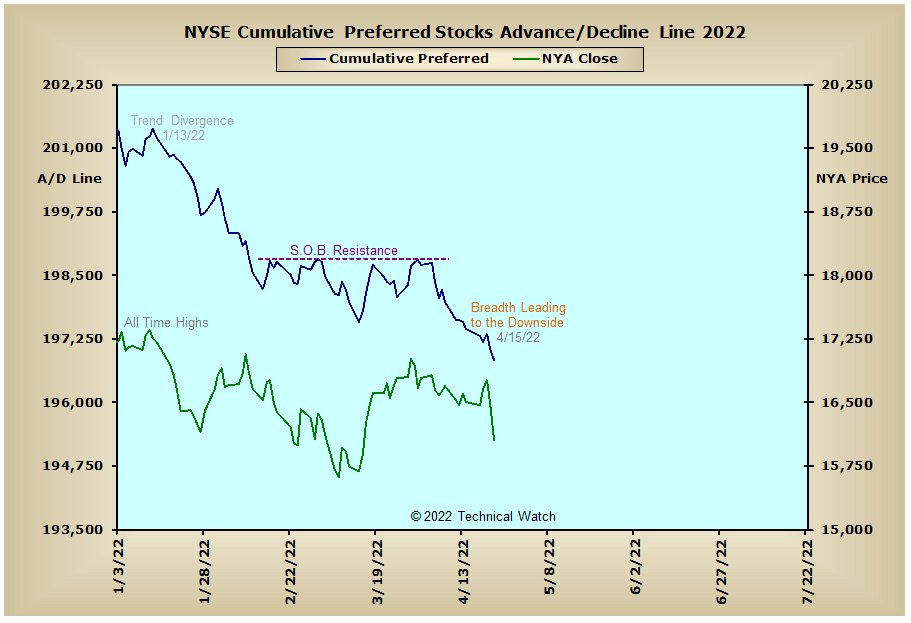
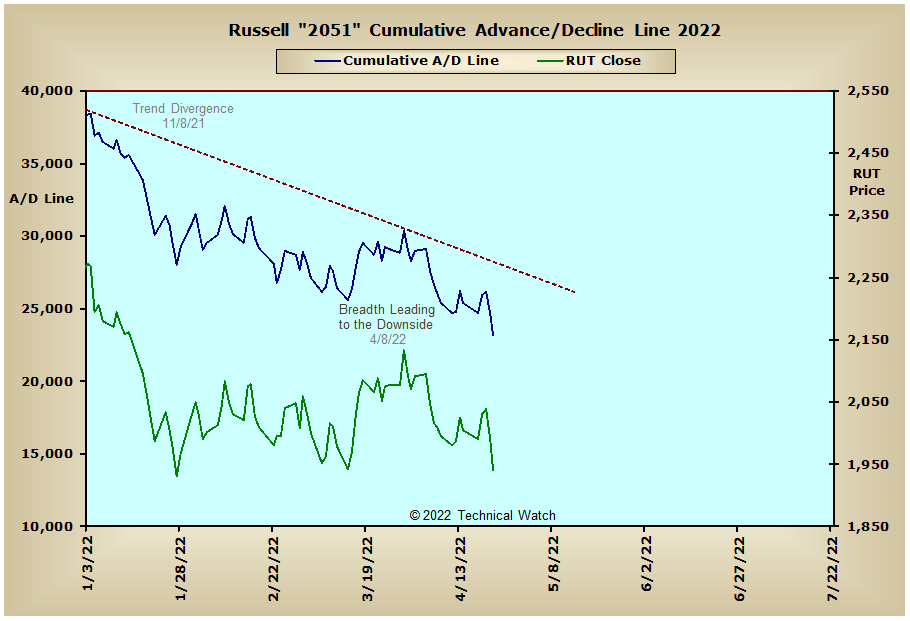
After attempting to rally from in and around their respective 200 day exponential moving averages into mid week, the major market indexes finally saw exhaustion Thursday afternoon before collapsing on Friday as they finished with an average weekly loss of -2.46%. The biggest casualty of this hard reversal came with the already weakened NASDAQ Composite Index which lost -3.73%, while the S&P 400 Mid Cap Index was able to pare its losses to -1.73%.
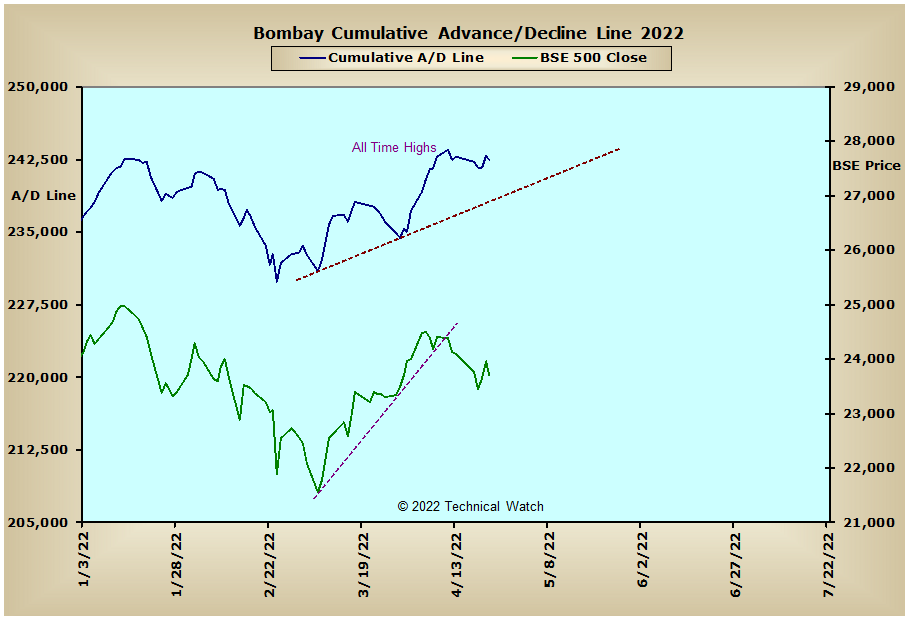
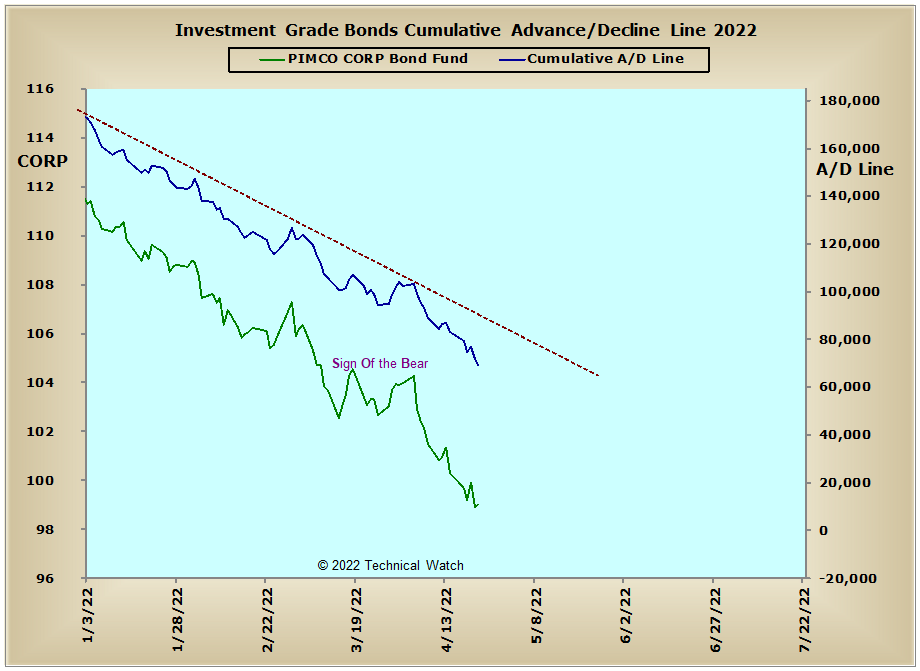
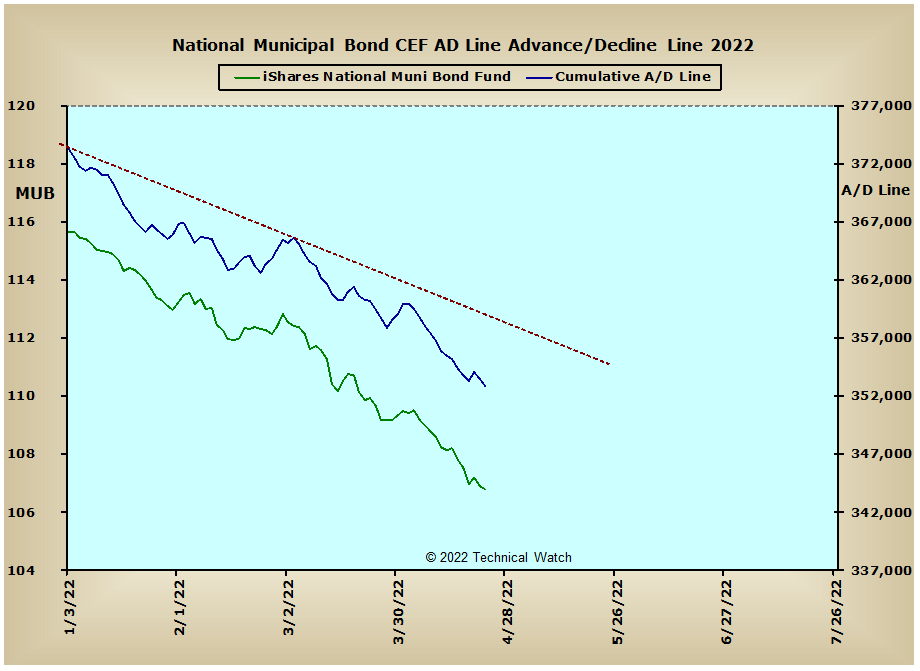
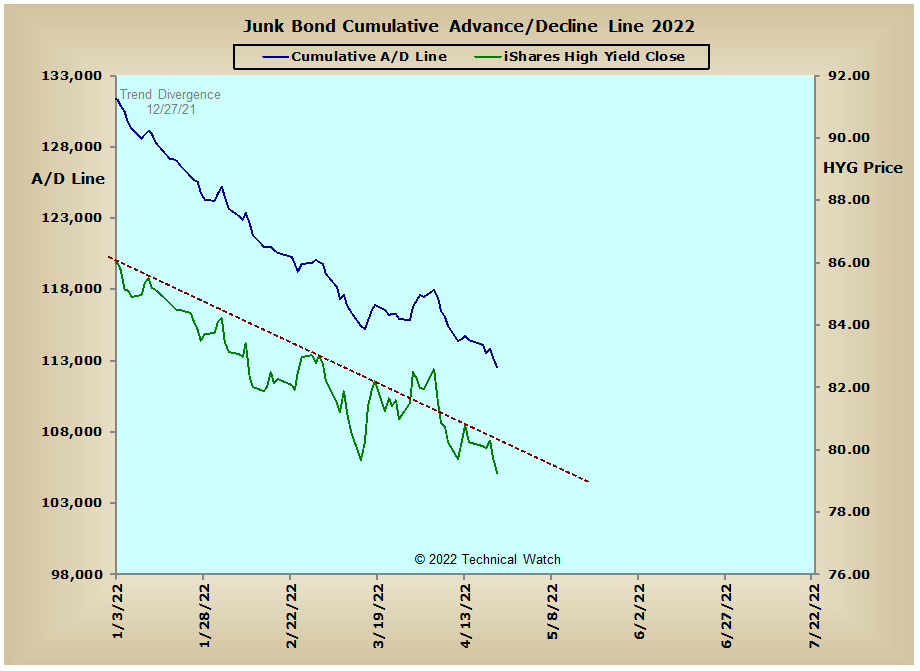
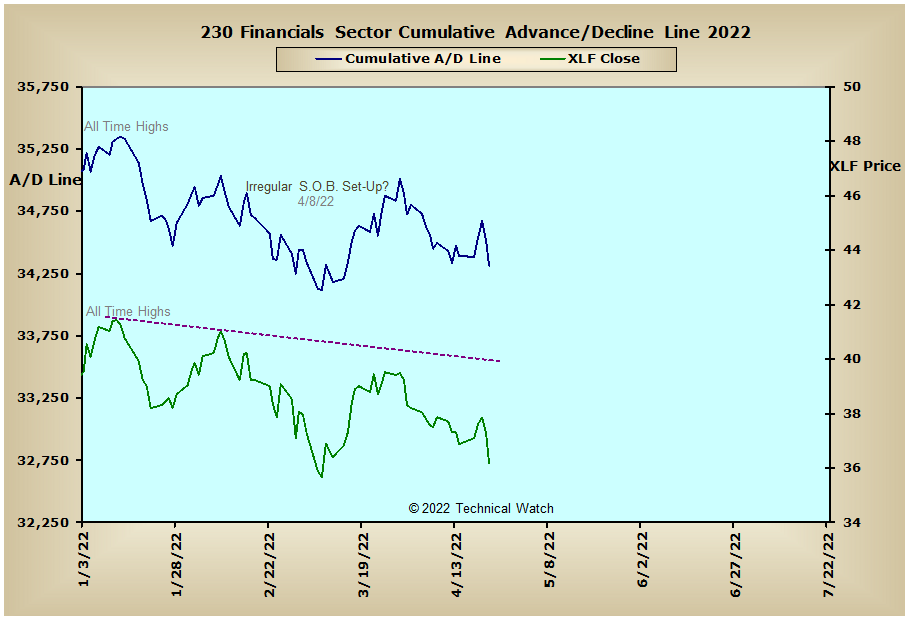
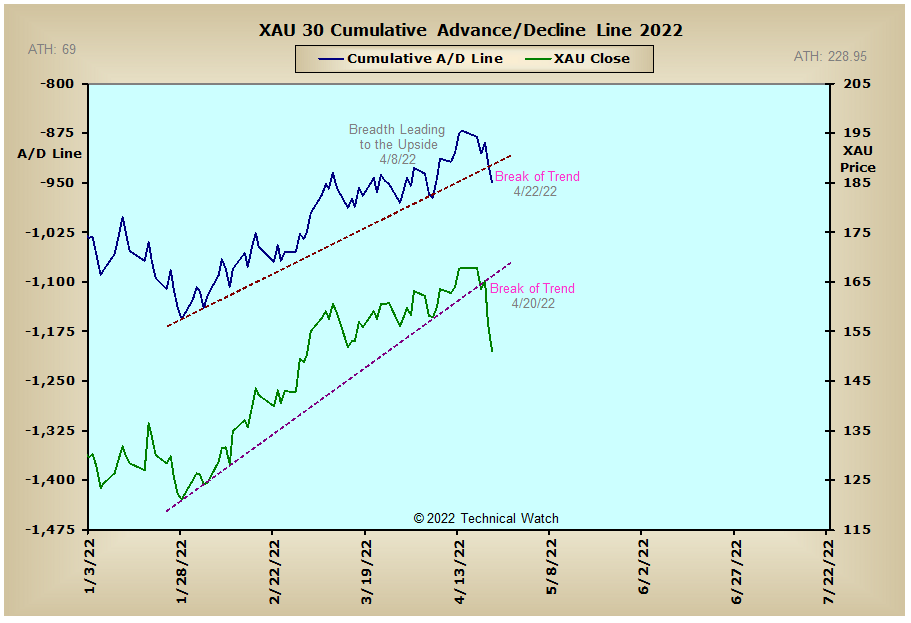
Looking at this past week's market data shows that the overall trend of money flow remains with a negative bias as tops beneath tops and variations of Sign Of the Bear pattern structures remain in vogue. The advance/decline lines of interest rate sensitive issues continue to move sharply to the downside as the anticipation of still higher interest rates over the next few months is currently being discounted. With this larger liquidity pool continuing to be drained at an accelerated rate, this will persist in putting a ceiling on stock prices, with an overall negative bias, as we go into the month of May. This current weakness is now spreading into the earth commodity segments of the economy as well with the XAU advance/decline line actually breaking below its intermediate term trendline on Friday, while the Precious Metals and Energy Sector advance/decline lines settled on these same structural lines of support. Trading in both Australia and Europe remains with a negative bias as well, while the Bombay advance/decline line continues to hold up in spite of this larger global decay in financial instruments.
So with the BETS moving sharply lower to a reading of -40, investors can once again re-initiate short positions with protective stops. Looking at both the breadth and volume McClellan Oscillators show that all remain in negative territory, with some at their lowest levels since the last week of February. The NYSE daily TRIN got up to a reading of 1.96 with Friday's sell off and this pushed the Open 10 to an "oversold" reading of 1.18, while the NASDAQ daily TRIN was only minimally "oversold" as it finished at 1.01 and the Open 10 at .95. The 10 day average of put/call ratios finally saw some movement on the put side last week, but still remains well below the levels where we've seen prices bottom in the past. The buying of put options also increased significantly enough on Friday for the ISEE Index to finish with a reading of 70...its lowest levels since September 30th of last year. Last week's Bollinger Band squeeze in implied option volatility provided the decisive move that we were looking for at the end of the week as all finished outside the upper end of this same analytical tool. With a whole myriad of both economic and geopolitical questions still left unanswered, the week ahead is likely to become more volatile as the intermediate term trend of money flow continues to move to the sidelines and possibly into the safety of such short term instruments as 6 month Treasury Bills which are now yielding 1.34%. With all this as a backbone then, let's go back and walk the bearish path of least resistance for the week ahead, while at the same time, keeping a disciplined posture until we see solid evidence of prices actually impulsing to the downside.
Have a great trading week!
US Interest Rates: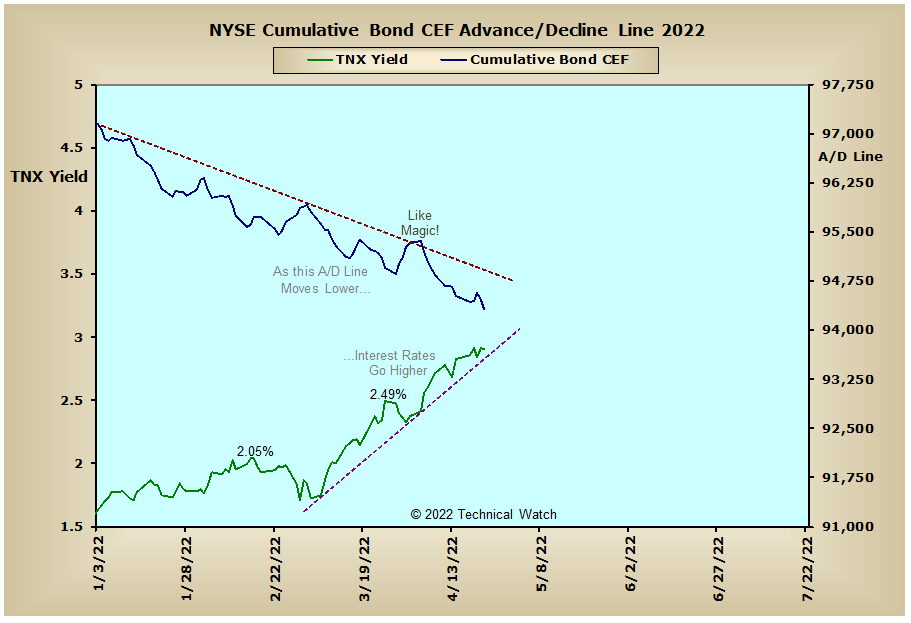
US Sectors: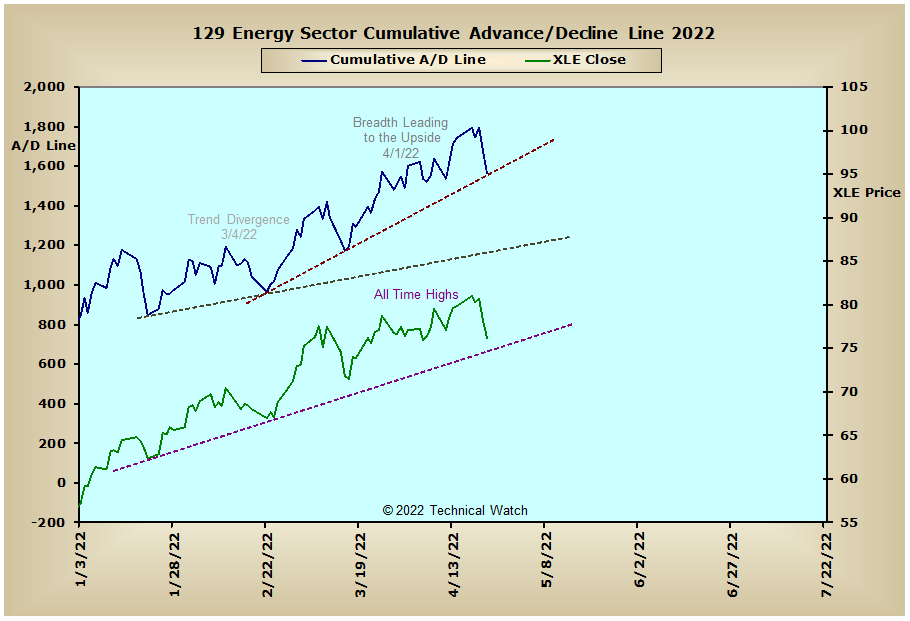

Precious Metals: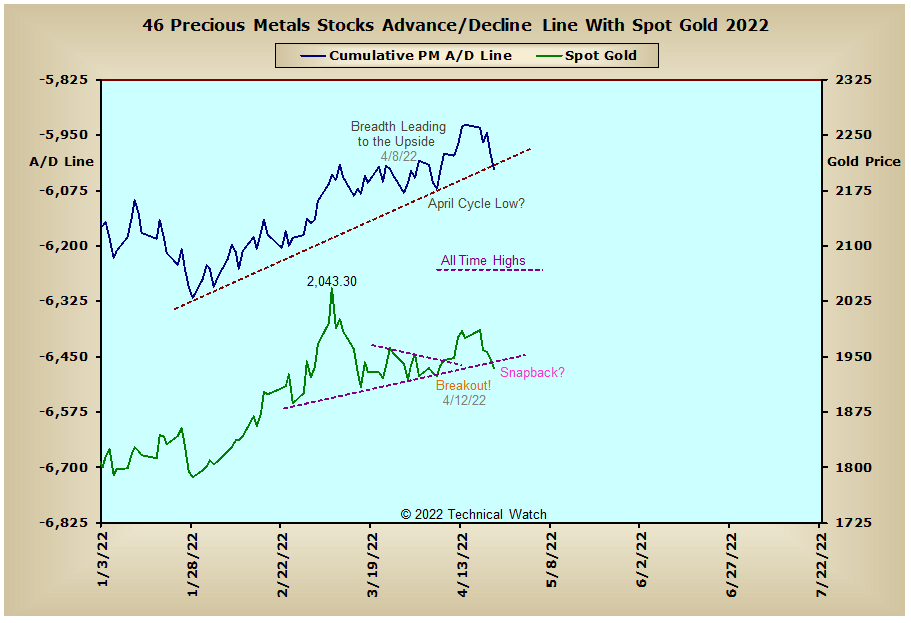
Australia: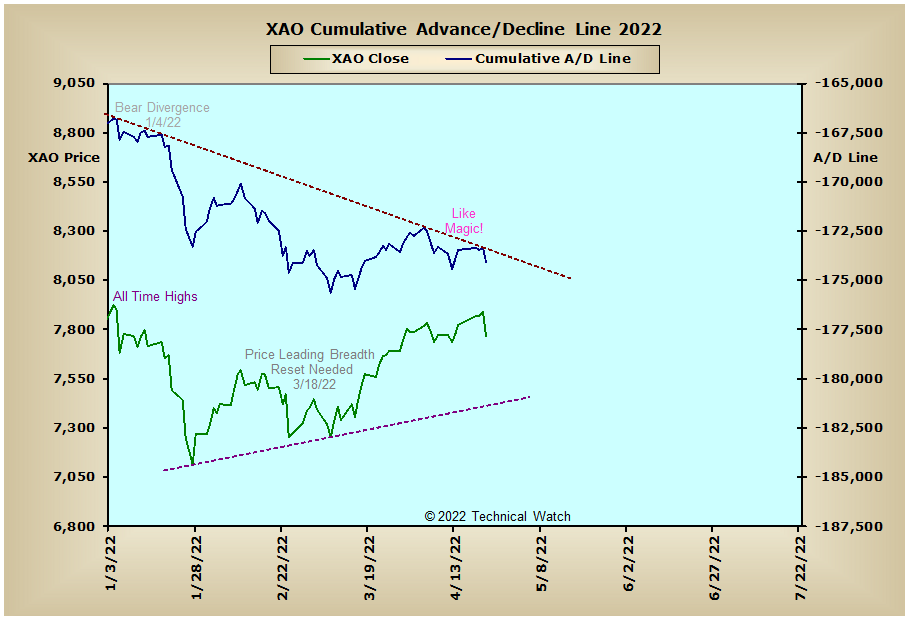
England: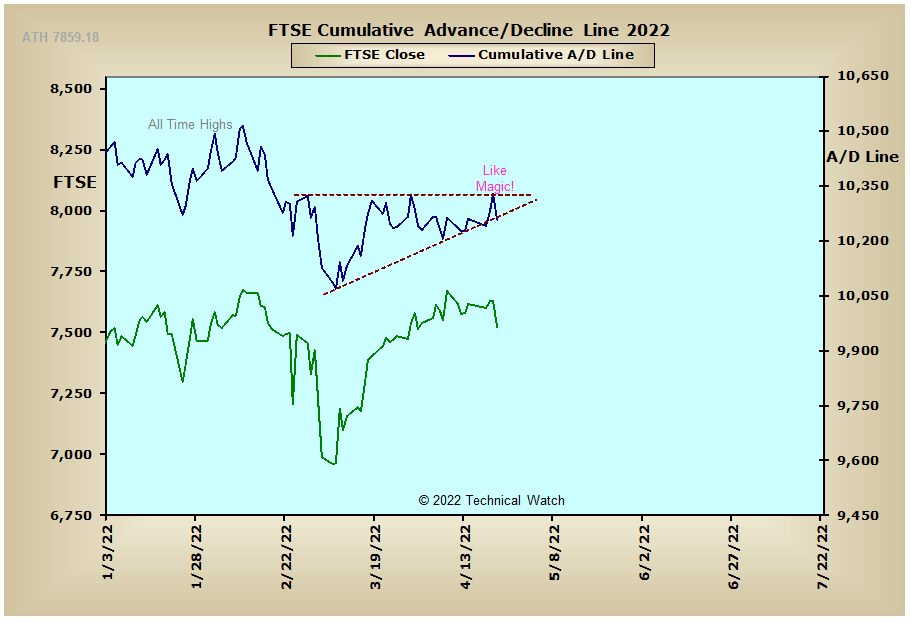
France: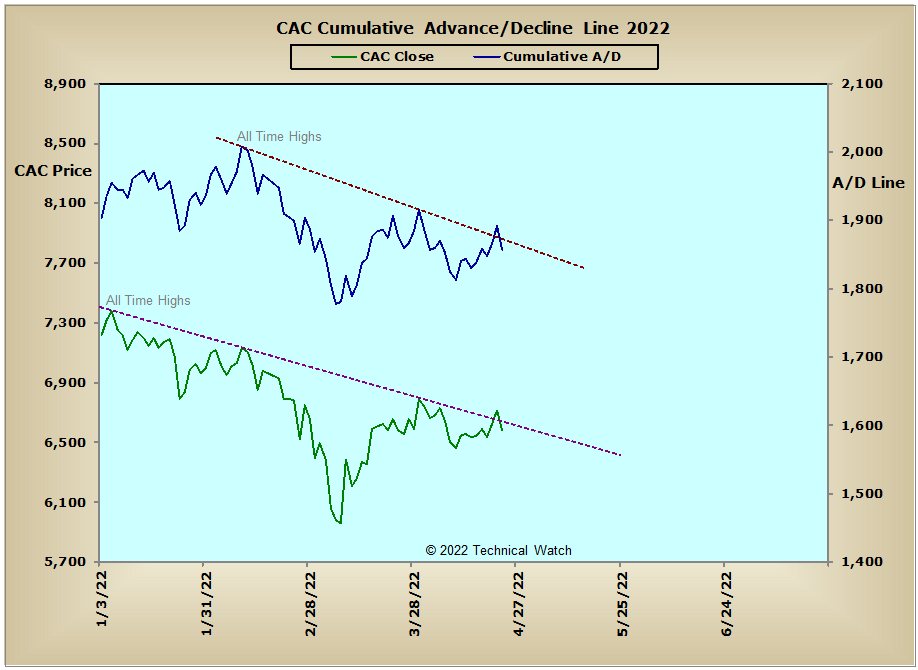
Germany: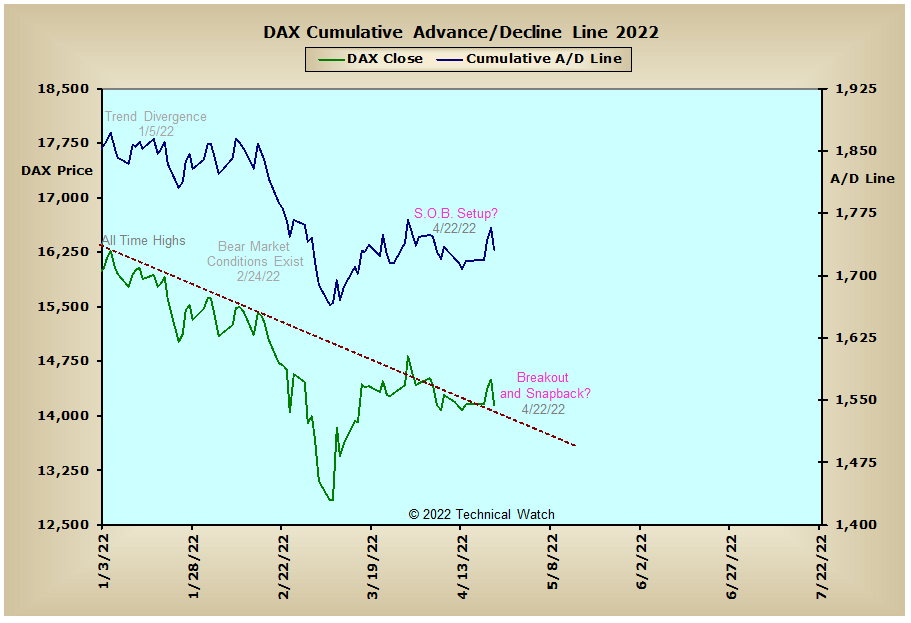
India: