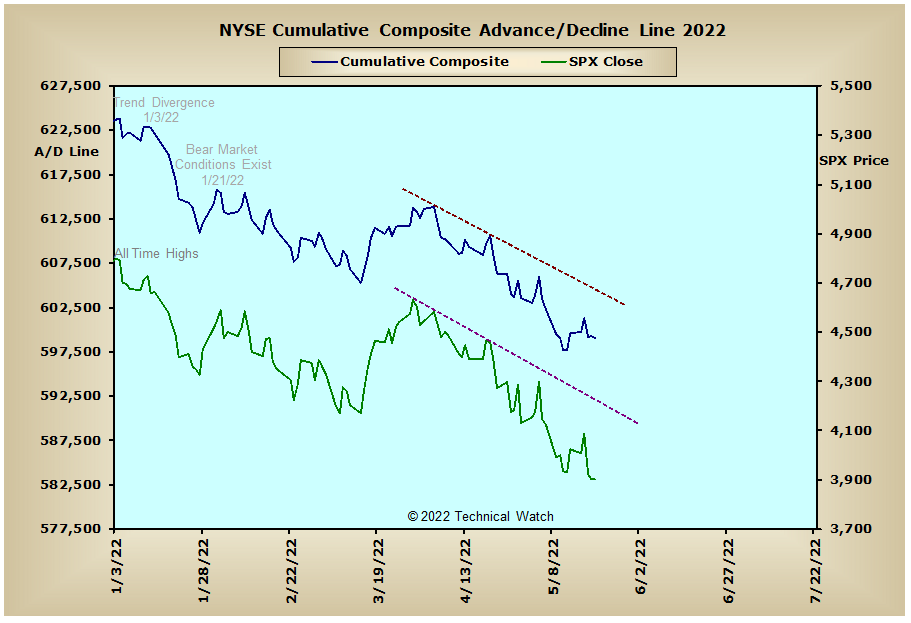
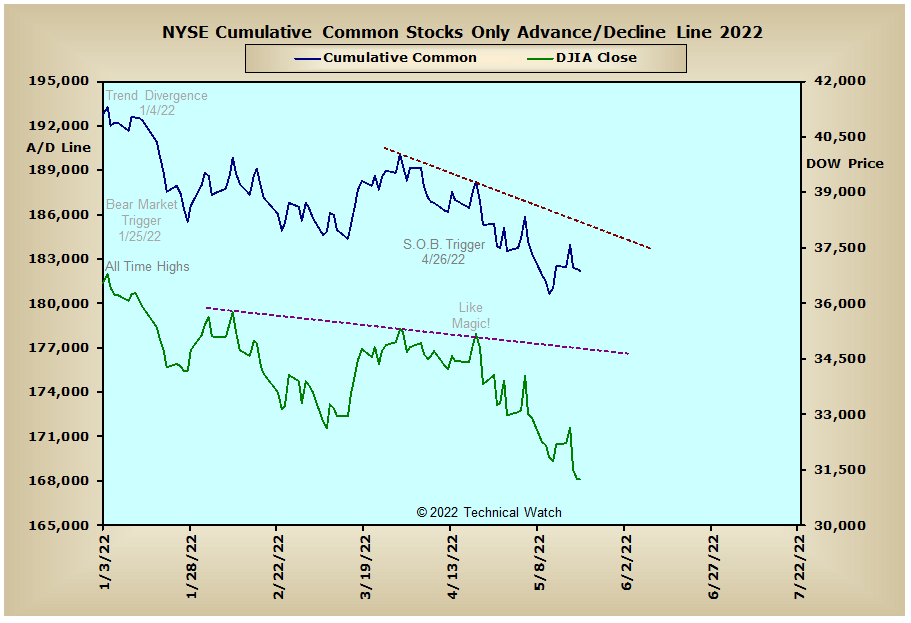
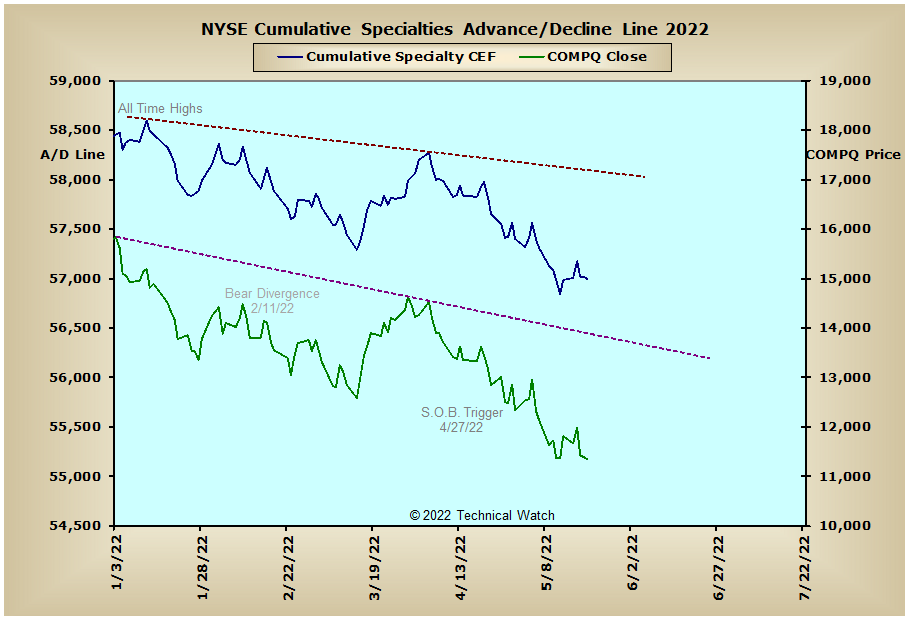
After seeing a bullish surprise on Tuesday, the major market indices then reversed sharply to the downside on Wednesday before finishing on Friday with an average loss of -2.38% and running its weekly losing streak to seven. Leading to the downside this week was the NASDAQ Composite Index at -3.82%, while the New York Composite Index held up better than the rest at -1.16%.
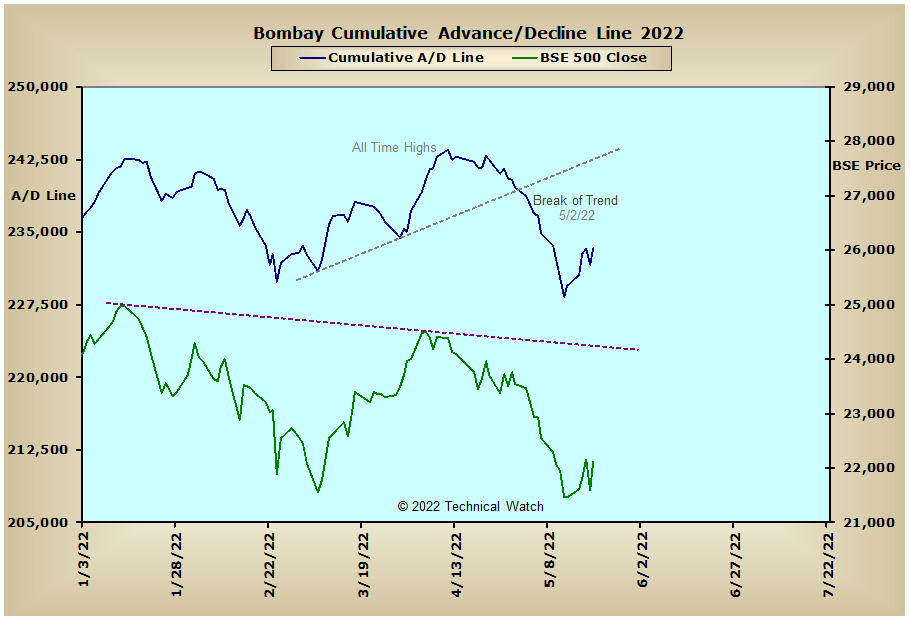
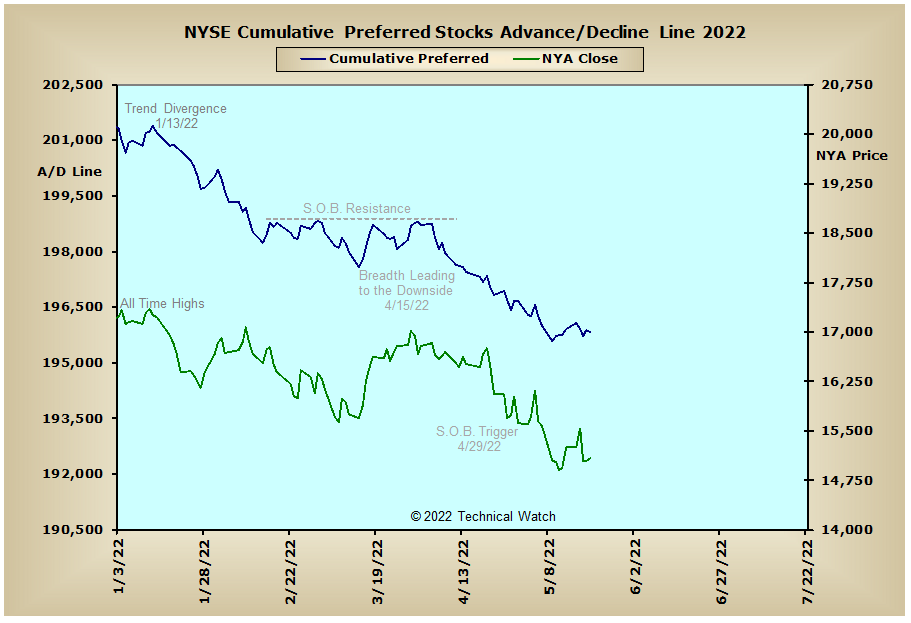
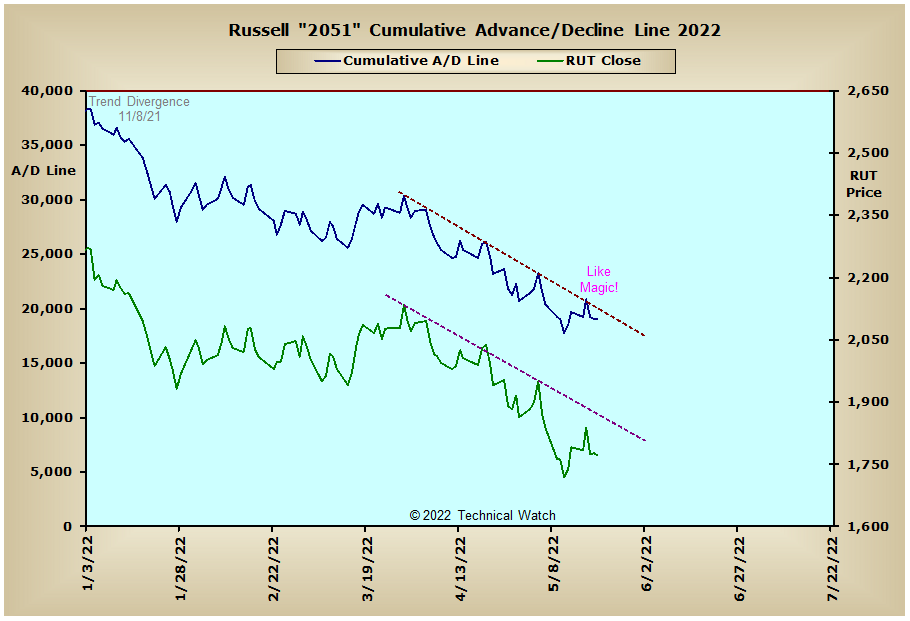
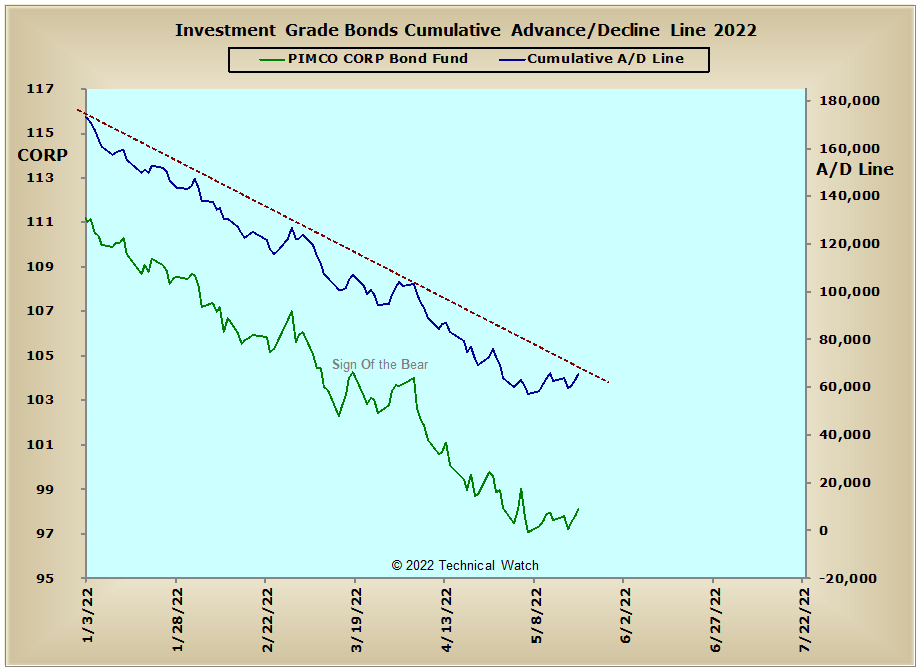
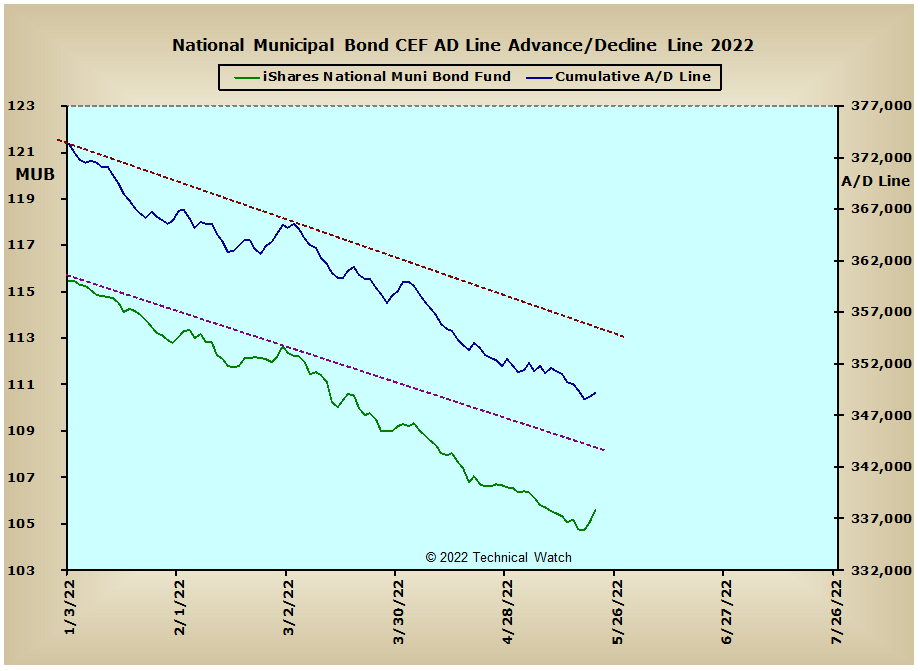
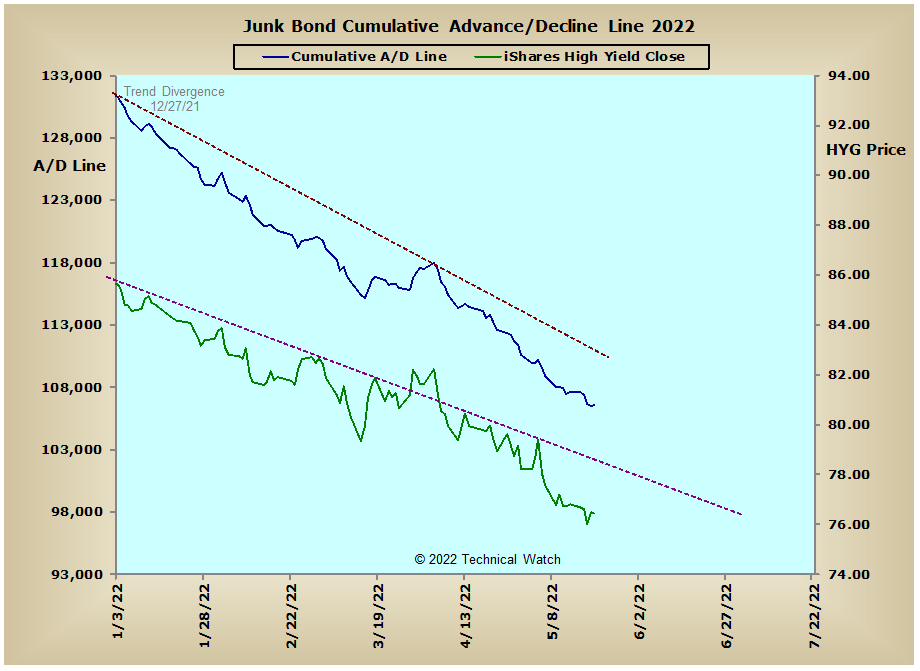
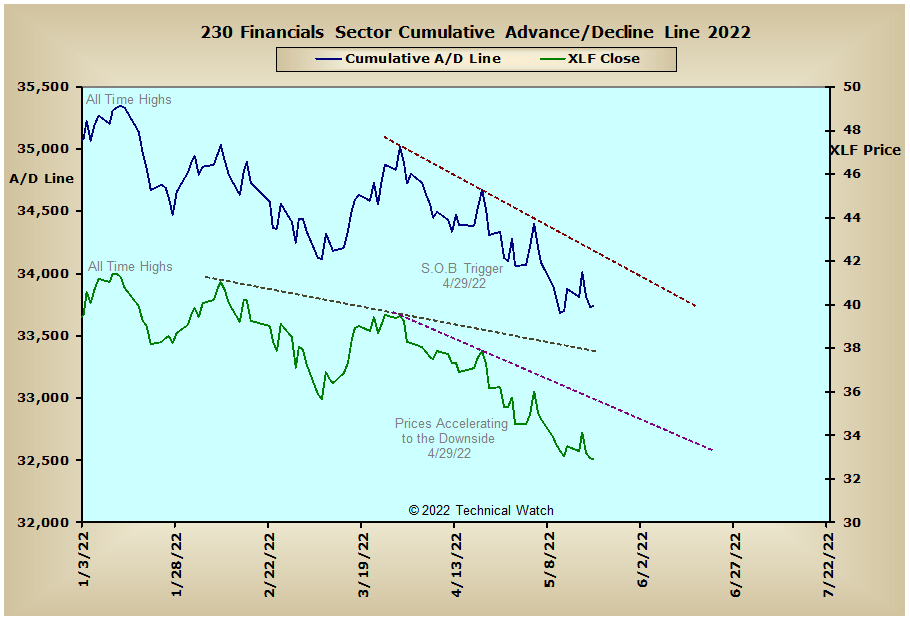
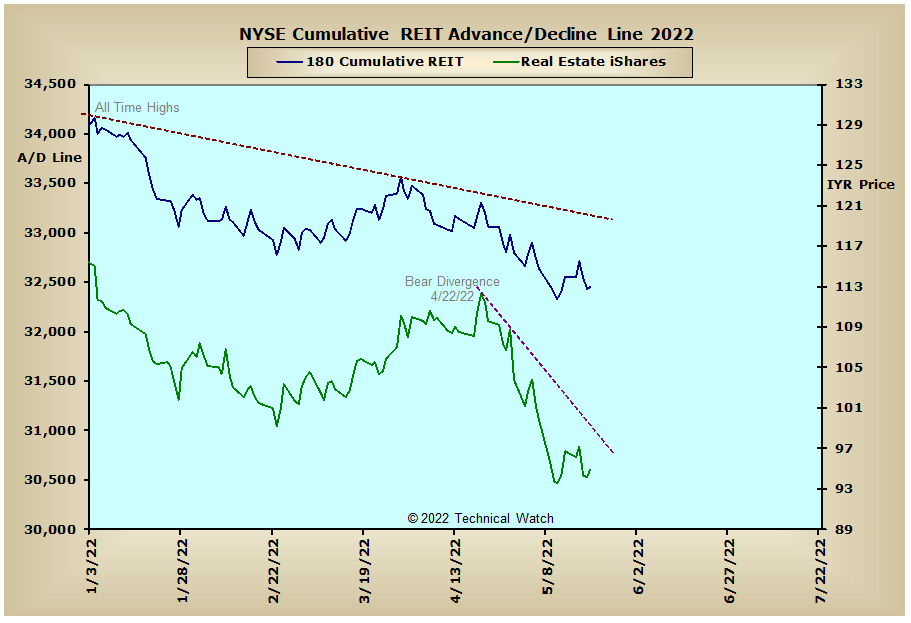
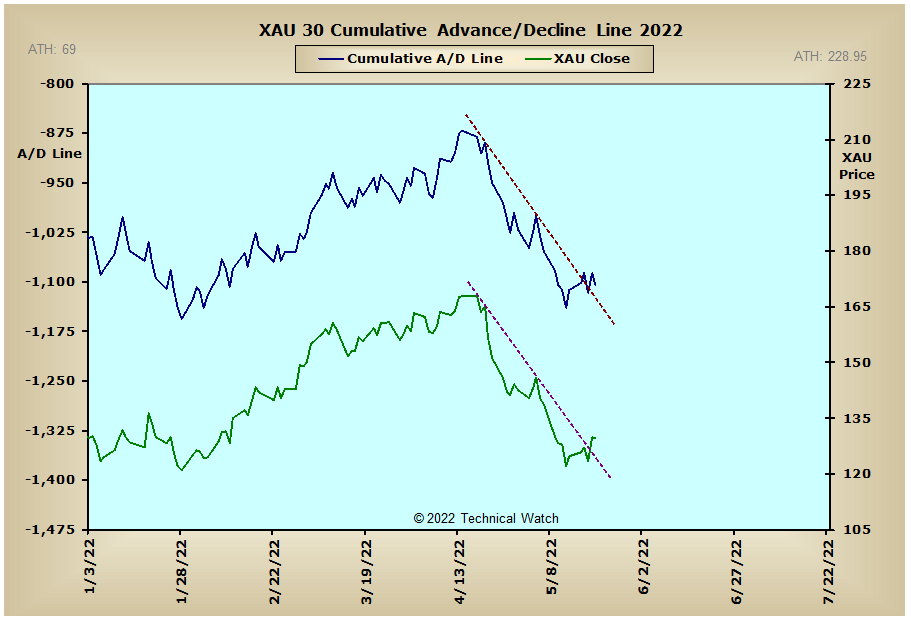
As we review this week's standard list of cumulative breadth charts shows very little in the way of analytical changes from the week before as the data maintains a series of tops beneath tops. Even more pressing was the rebound we saw last week in Treasury Notes and Bonds with very little in the way of fresh investment capital participation accompanying it with the possible exception of the Investment Grade Bonds advance/decline line. In other areas, weakness in the U.S. Dollar allowed both the Precious Metals and XAU advance/decline lines to perceptively break out above their 2 month declining trendlines, while the Energy Sector advance/decline line broke out to new recovery highs. This, or course, is not good news for both the equity and debt asset classes as we move into the 3rd quarter of 2022 as higher oil prices and, by extension higher interest rates to fight off inflation, will keep consumer budgets very tight with both discretionary and even everyday purchases being put on hold unless absolutely necessary.
So with the BETS back to challenging its recent lows at -55, traders and investors continue to work with a hostile market environment. As we start the post OPEX week ahead we see that the vast majority of both the breadth and volume McClellan Oscillators are either at or near their zero lines. This would suggest that there is currently "tension on the tape" that, once released, will provide a short term directional bias for prices as we move into the month of June. Wednesday's sharp sell off produced the highest daily NYSE TRIN reading since the August 2019 lows at 3.42 which bumped up the NYSE Open 10 to a deeply "oversold" reading of 1.35. TRIN readings this high make it very difficult to keep prices moving and staying lower on a near term basis...very much like a holding down a basketball below the water line in the deep end of the swimming pool, and then upon releasing it, forcibly thrusts back above the water line (we saw this with Friday's huge intraday reversal). The 10 day average of the equity put/call ratio showed a pick up in put buying last week and is now nearing levels where we've seen important market bottoms over the past 6 years. The Wall Street Sentiment Survey, however, continues to show lopsided bullish sentiment over the last 10 weeks, and until we see a significant change in trader's attitudes of conditioned bottom picking, the theory here is for prices to continue to move to lower lows until this mind set is finally broken. With a 3 day holiday weekend coming up here in the United States, market participation will likely diminish as the week goes along. Using all this as a backdrop then, let's continue with a defensive posture for the week ahead, while continuing to watch for another bullish scare just to keep us from getting too complacent with our current trading strategy.
Have a great trading week!
US Interest Rates: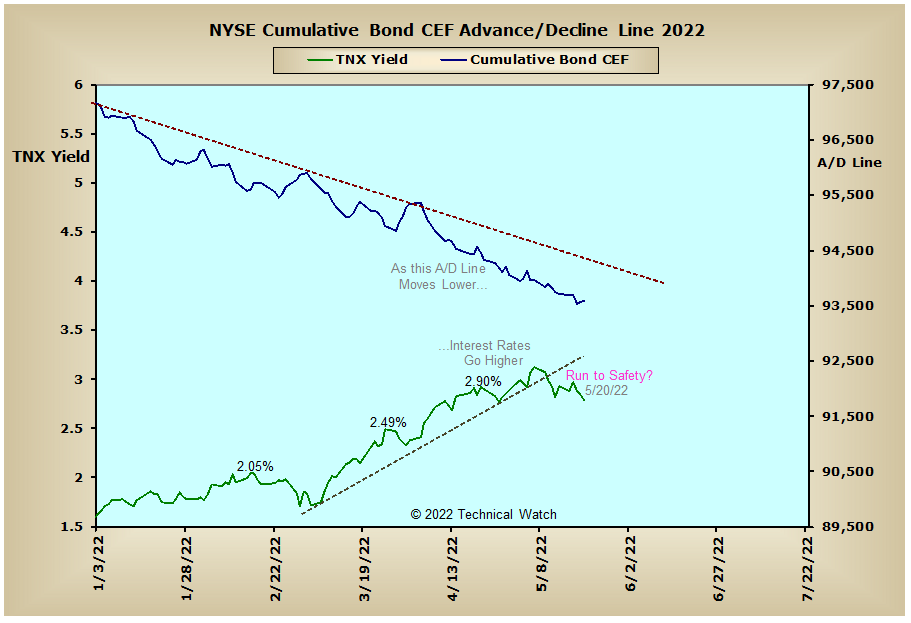
US Sectors: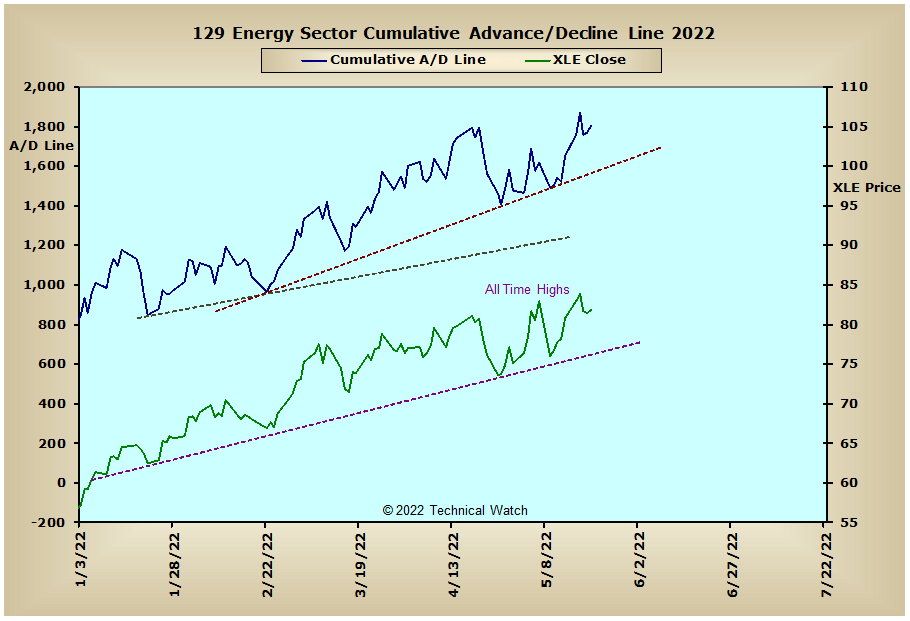
Precious Metals: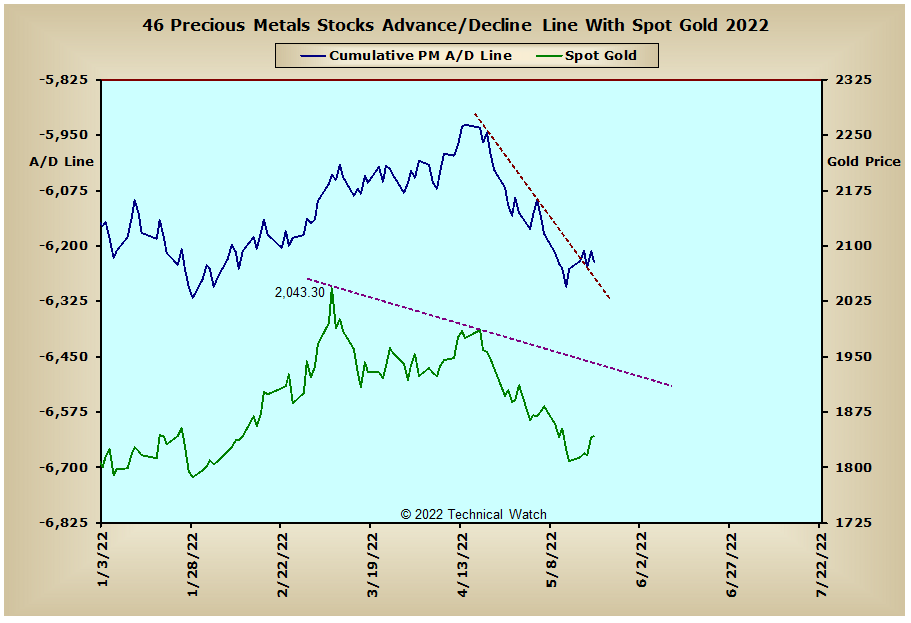
Australia: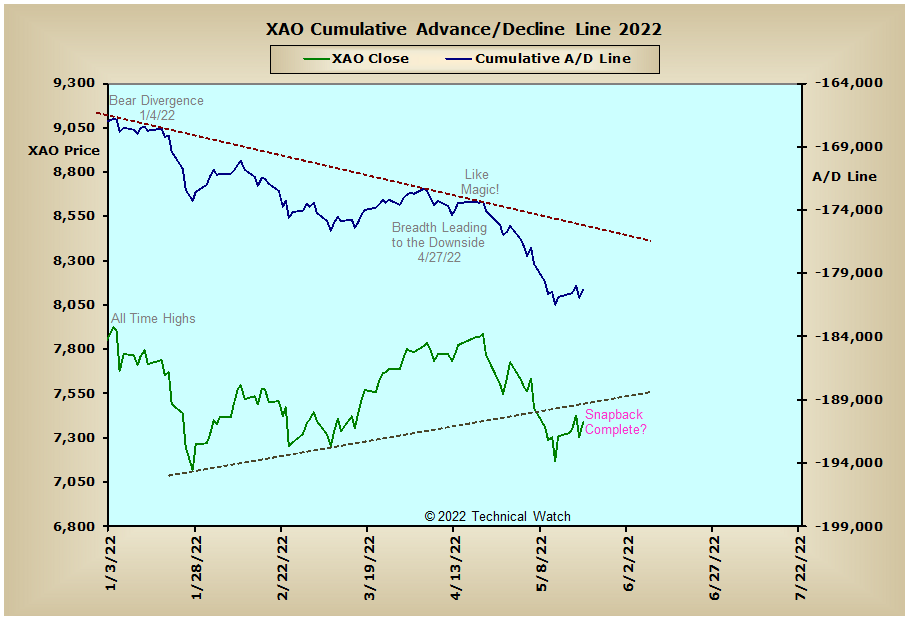
England: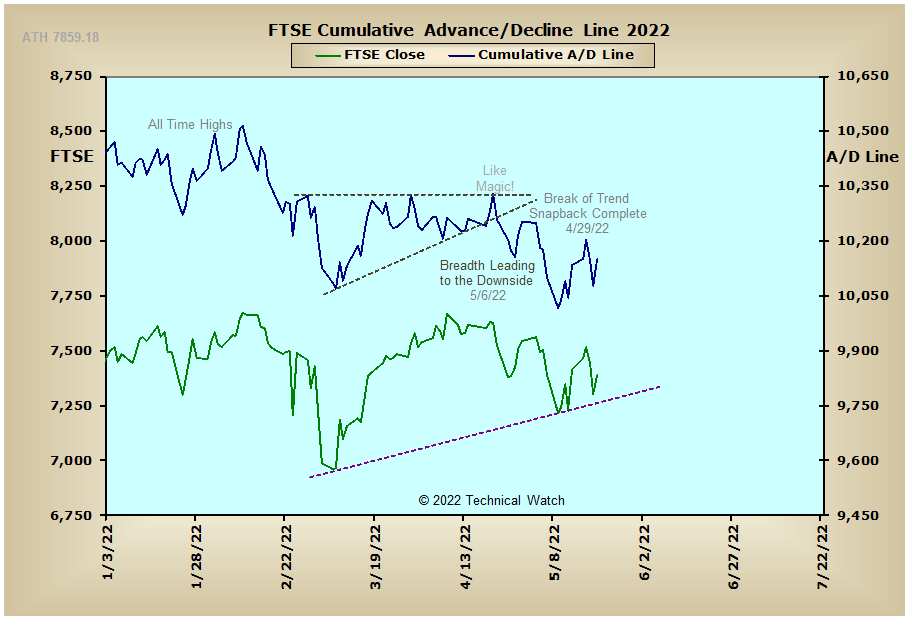
France:
Germany: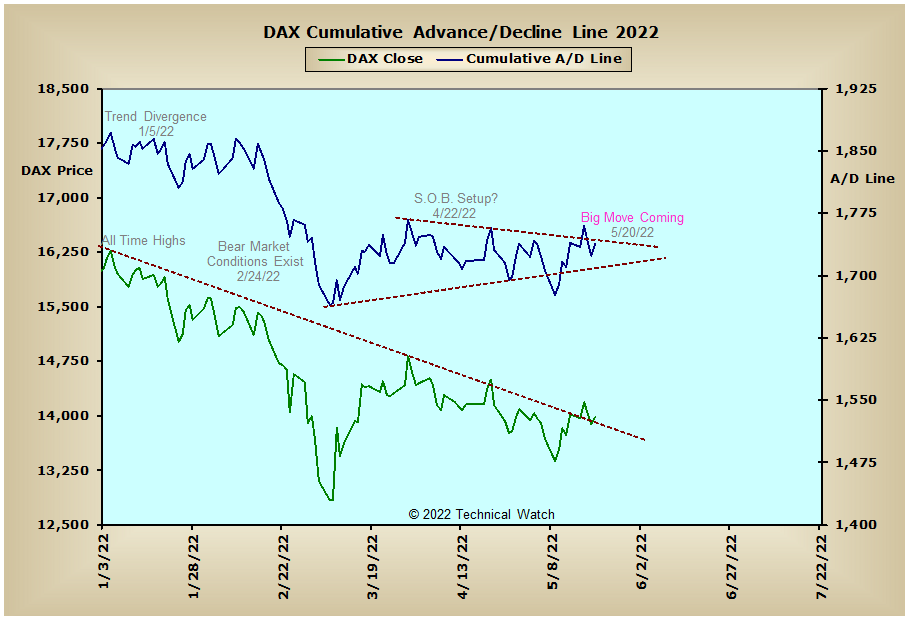
India: