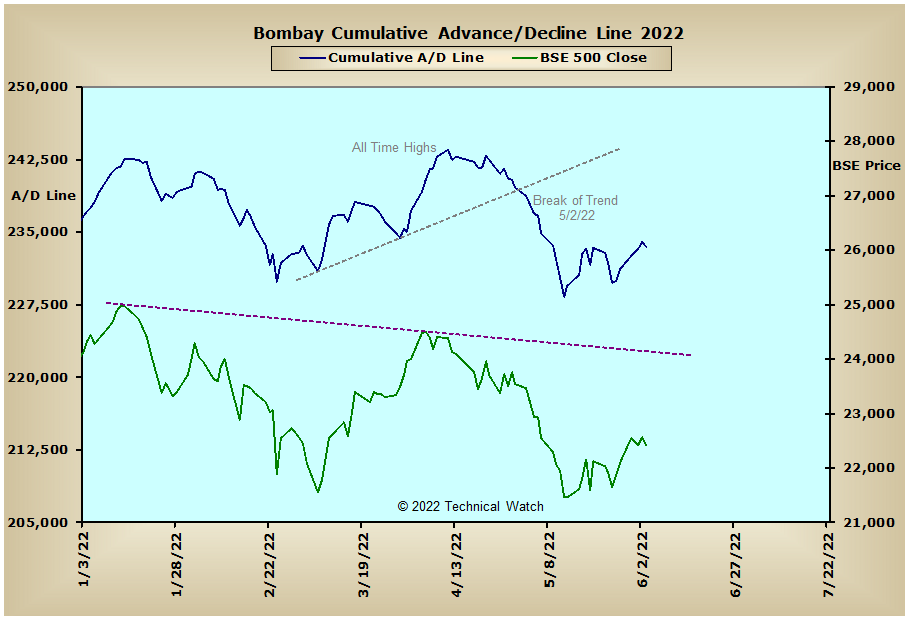
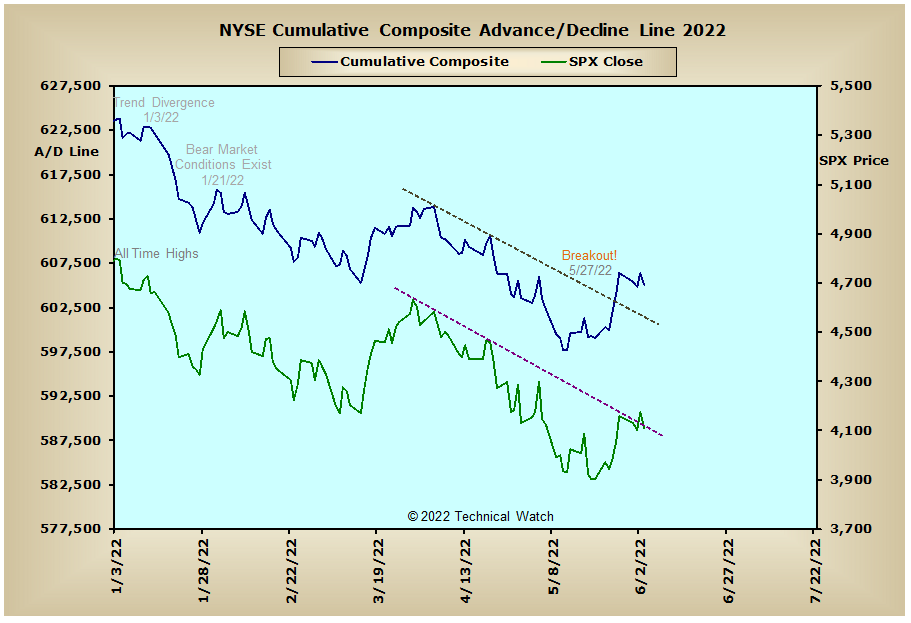
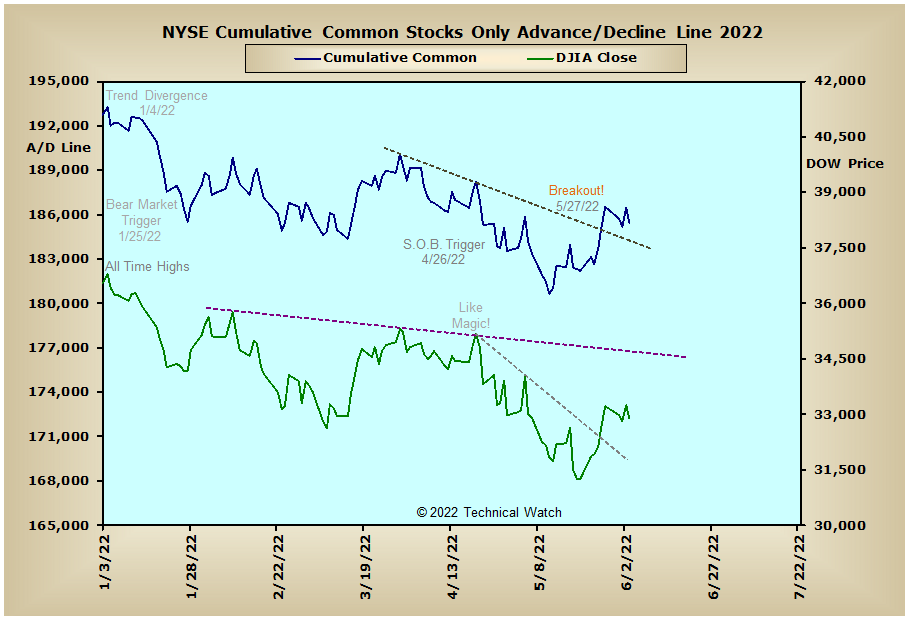
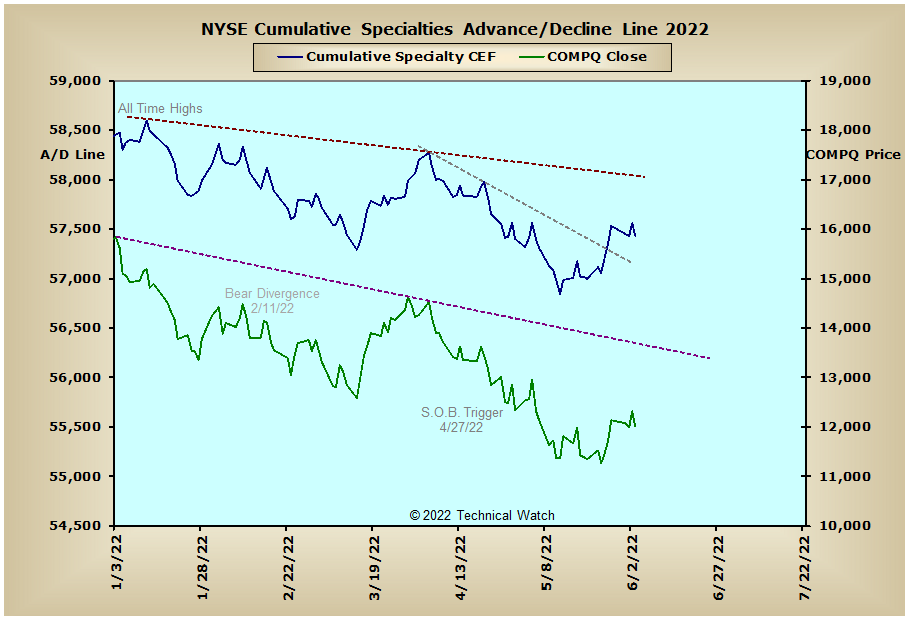
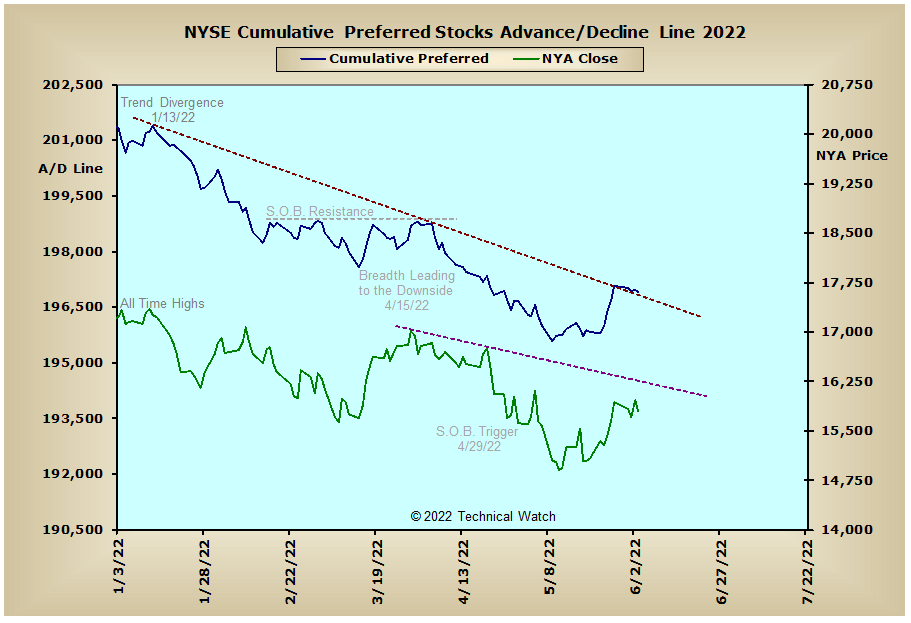
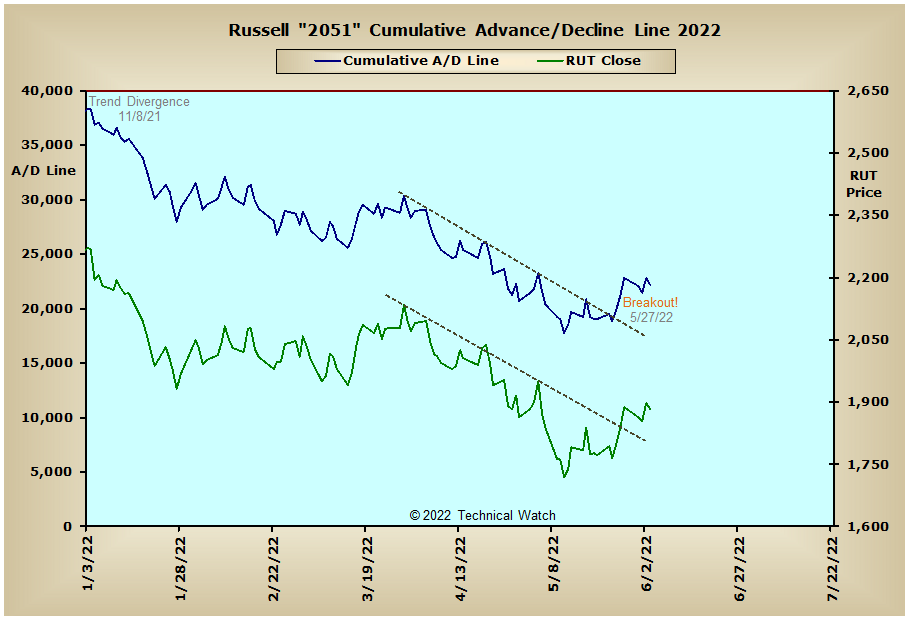
The holiday shortened week in the United States turned in a mixed performance as the major market indices consolidated their rapid gains from just the week before. Market participation was again balanced, though this time around, the week finished with an average loss of -.87% which brought the month of May's final average tally to just a slight gain of +.28%.
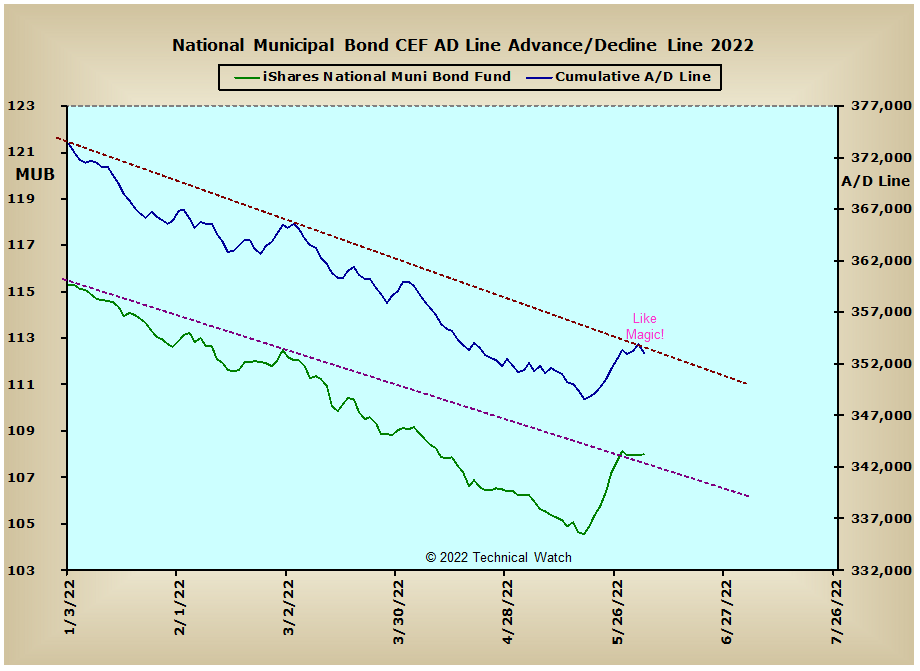
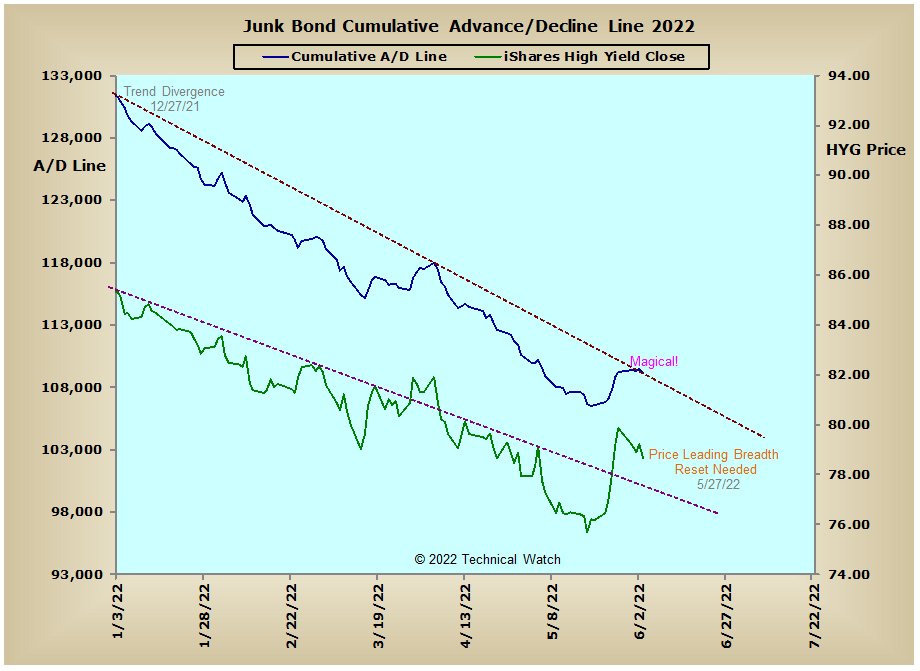
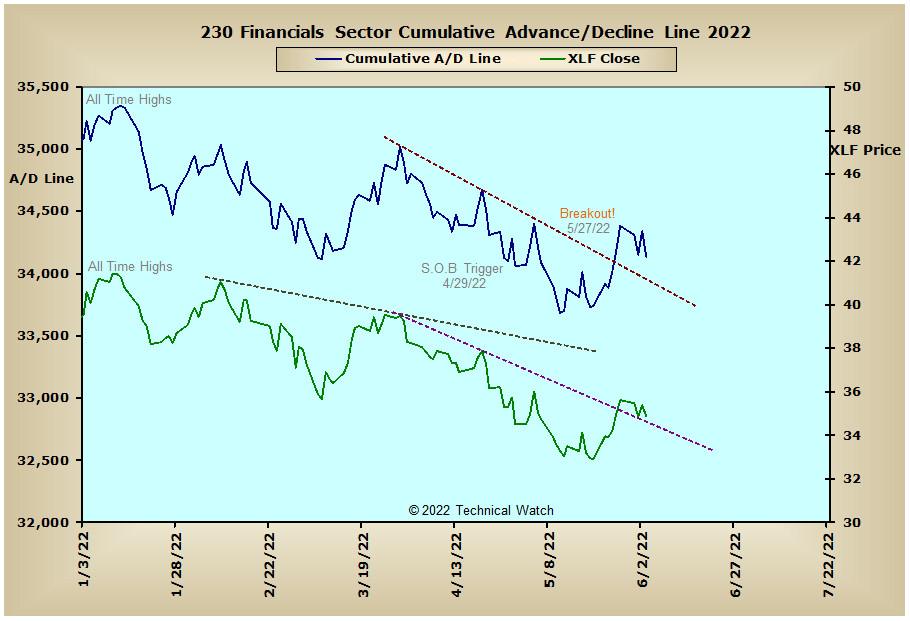
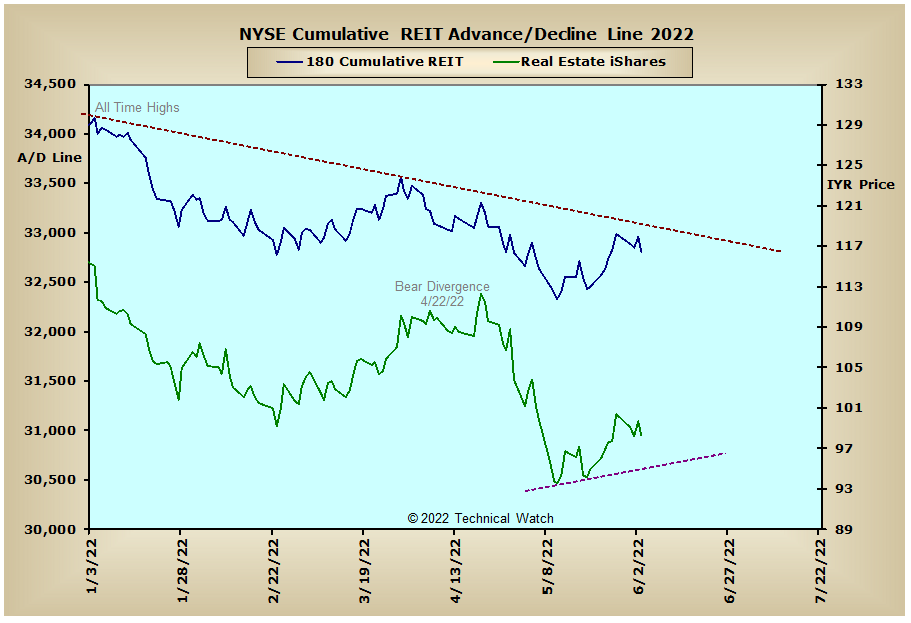
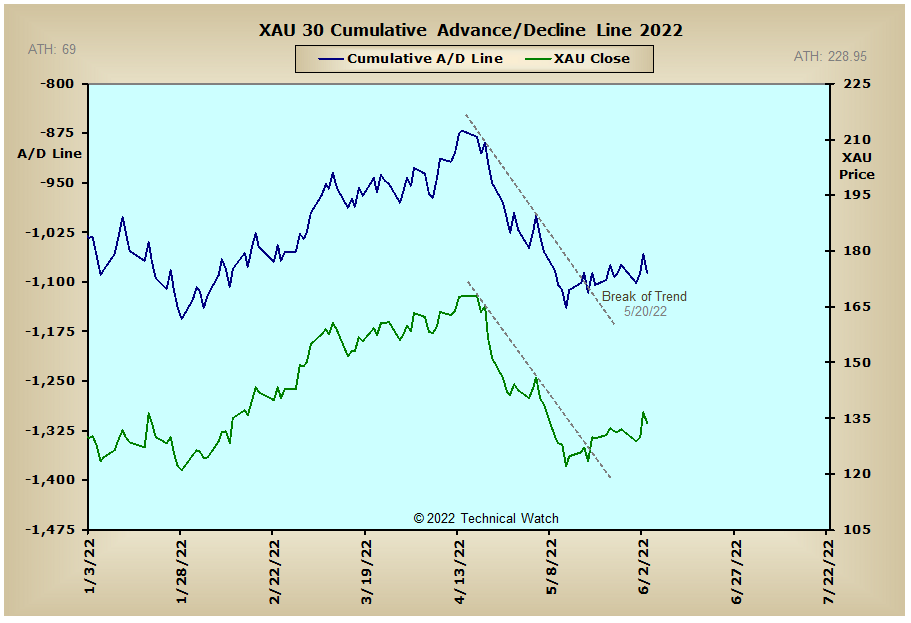
Looking over this past week's array of cumulative breadth charts shows that, like prices themselves, most moved nearly sideways with very little in the way of analytical changes. Both the Municipal and Junk Bond advance/decline lines were turned away from their longer term declining trendlines, while the NYSE REIT advance/decline line remains with a strong negative bias despite the recent pop in prices. Both the Precious Metals and XAU advance/decline lines continue to claw their way to higher highs, but on the flip side, the Aussie advance/decline line finished the week just above its all time lows. The big winner for the week, however, was again seen in the Energy Sector advance/decline line which continues to make new recovery highs as the XLE finished on Friday at new historic levels. With the price of West Texas Intermediate Crude Oil finally moving above pattern resistance at the $115 level, the expectation is for a successful challenge of the early March highs at $123.70 before taking on the all time closing highs from the summer of 2008 at $145.29 per barrel.
So with the BETS holding steady at -30, traders and investors continue with a bearish market bias. With a lessening of buying pressure noted with Thursday's rally, all of the breadth and volume McClellan Oscillators continued to work off their previous week's "overbought" extremes with the sole exception of the NASDAQ data which finished slightly above Wednesday's reaction lows. With several of the breadth and volume McClellan Summation Indexes starting at or just below their zero lines, the week ahead will be an important one for the buyers to see if they have enough investment capital behind them for prices to reach their upside targets generated by these same extreme "overbought" readings in the MCO's. Looking elsewhere, with the NYSE Open 10 finishing on Friday at 1.12, along with the NASDAQ Open 10 readings at .97, the near term expectation is for another rally attempt early in the week ahead. The 10 day average of put/call ratios continues to show a bias toward calls (prices moving higher) though the longer term trend remains with the puts (prices moving lower). This push and pull in (speculative) sentiment will likely continue for the week ahead until or unless prices breakout from their current game of "EMA tag" between their 20 and 50 day EMA's. With many of the major indices also completing simple snapbacks to or toward their previous lows of price support from earlier this year, the bulls will now need further backing from both investors and traders on a short term basis if they are to extend the current relief rally beyond this month's OPEX period and the prevailing headwind of higher energy costs. With all this in mind then, let's get off our neutral bench along the bearish path of least resistance and begin to stroll again while continuing to look out for, and step aside from, any bullish ambushes that might be hiding behind the vegetation ahead.
Have a great trading week!
US Interest Rates: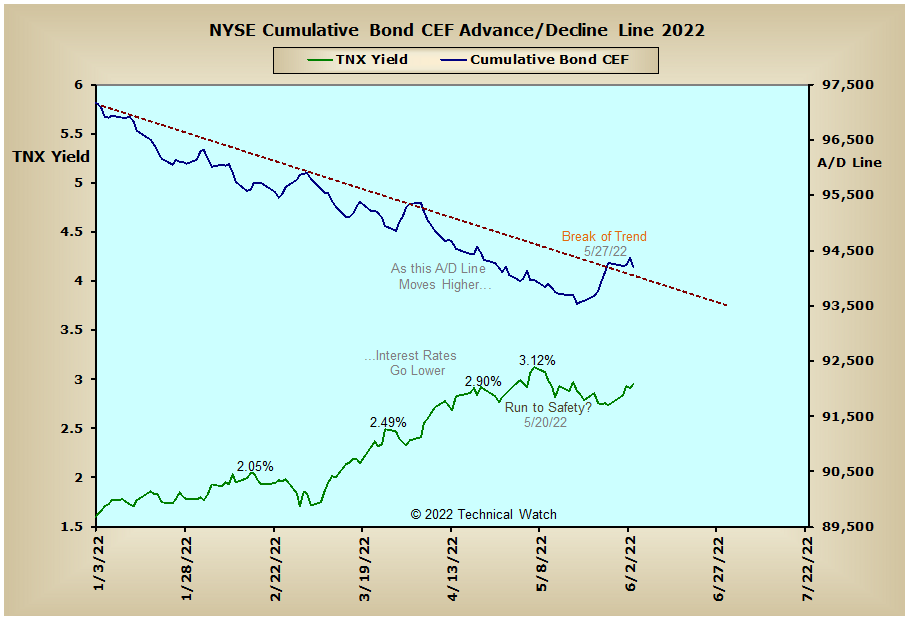
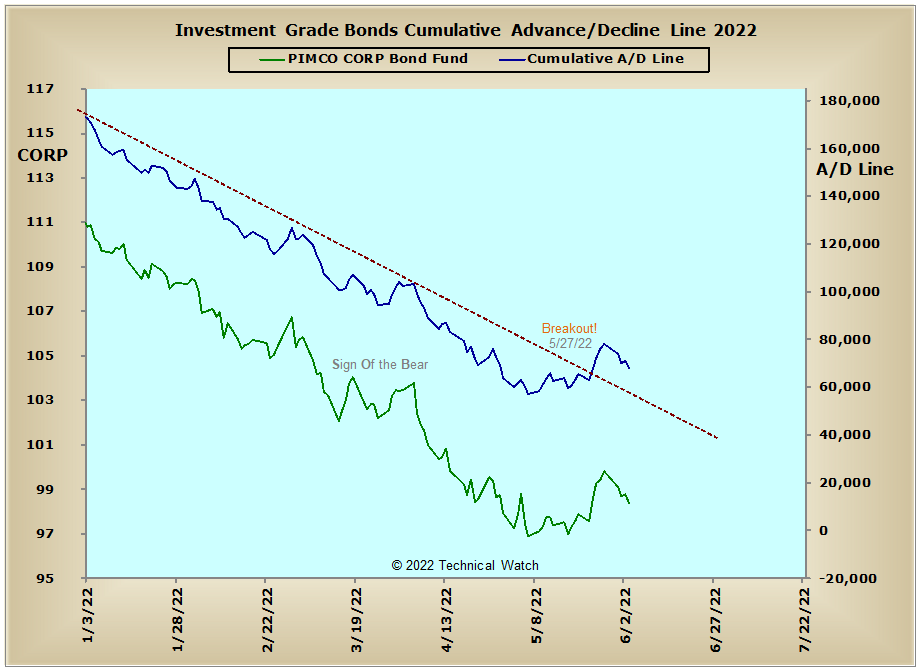
US Sectors: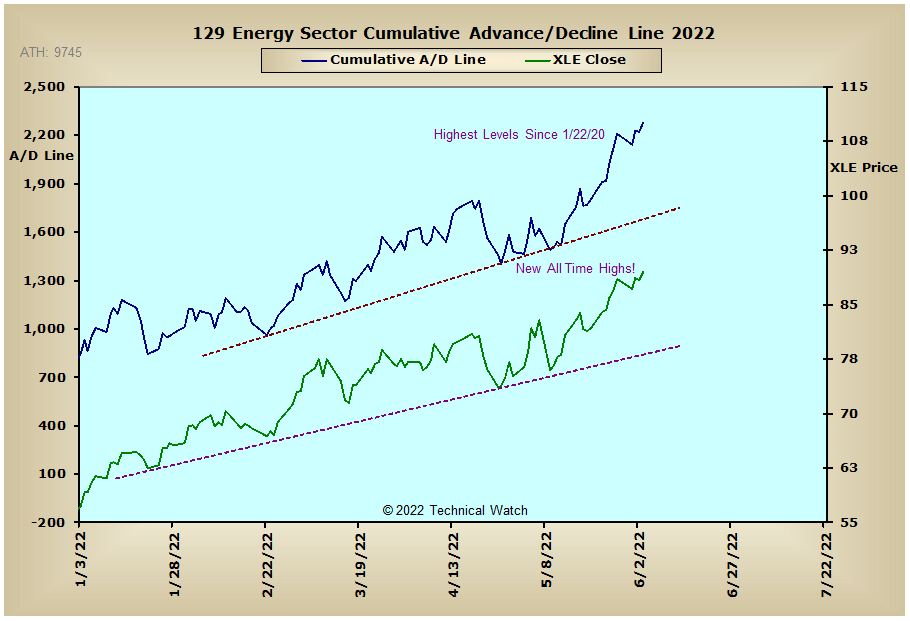
Precious Metals: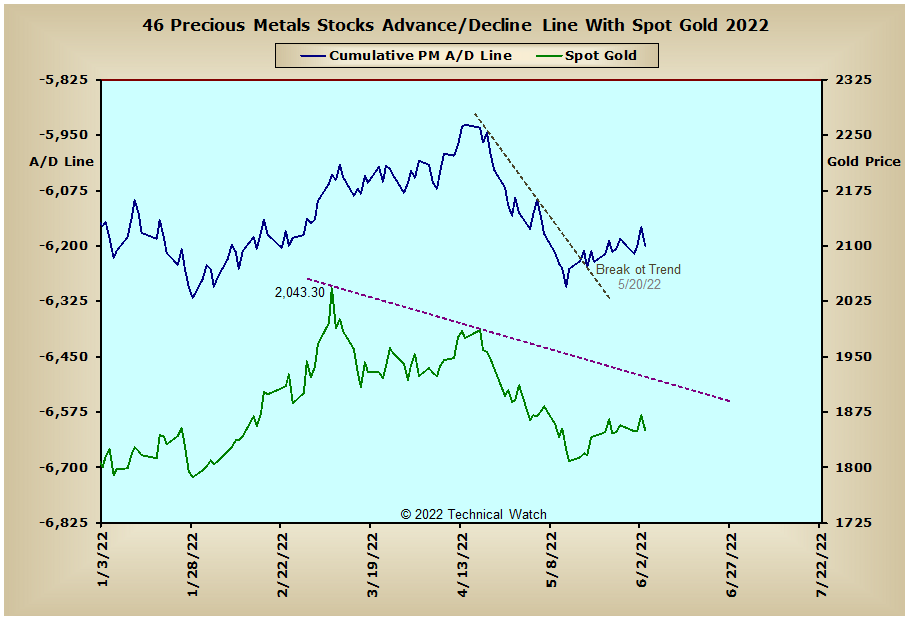
Australia: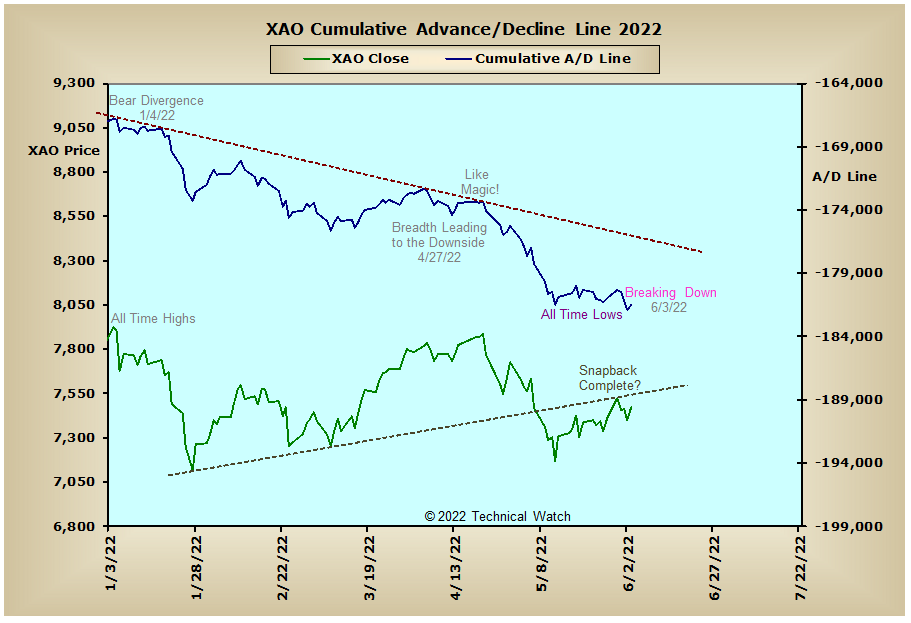
England:
France:
Germany:
India: