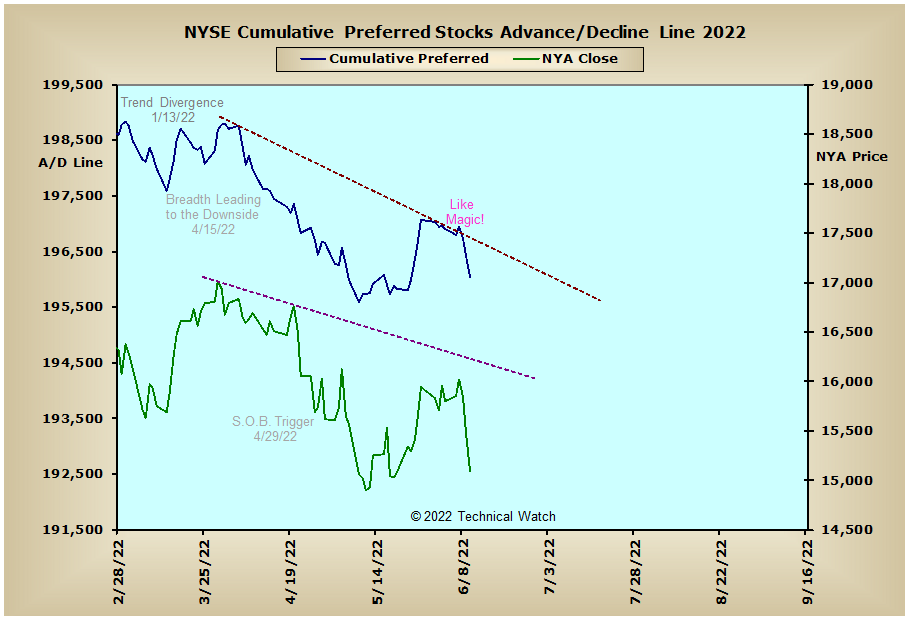
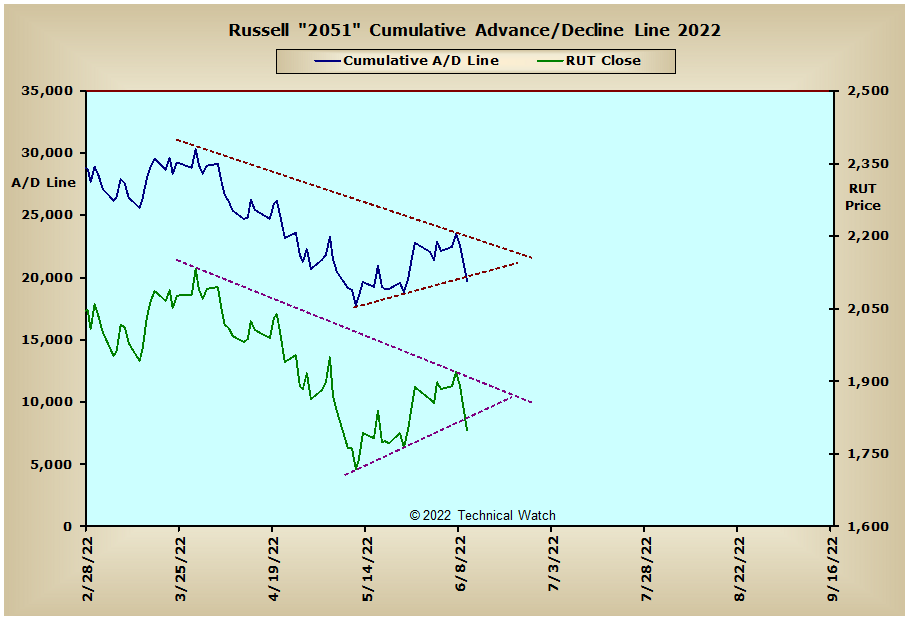
Please note that the time axis has been adjusted this week to provide better analytical value moving forward.
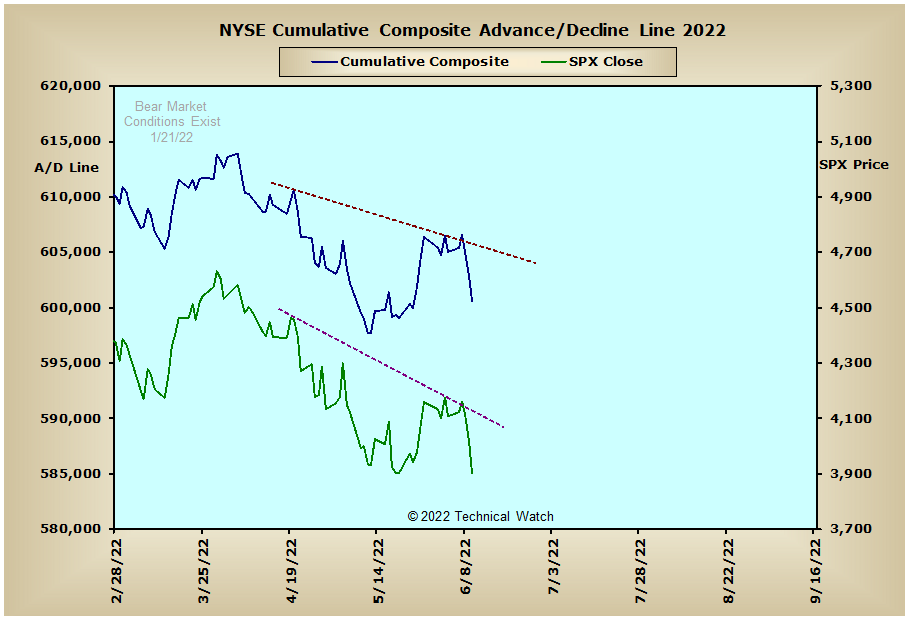
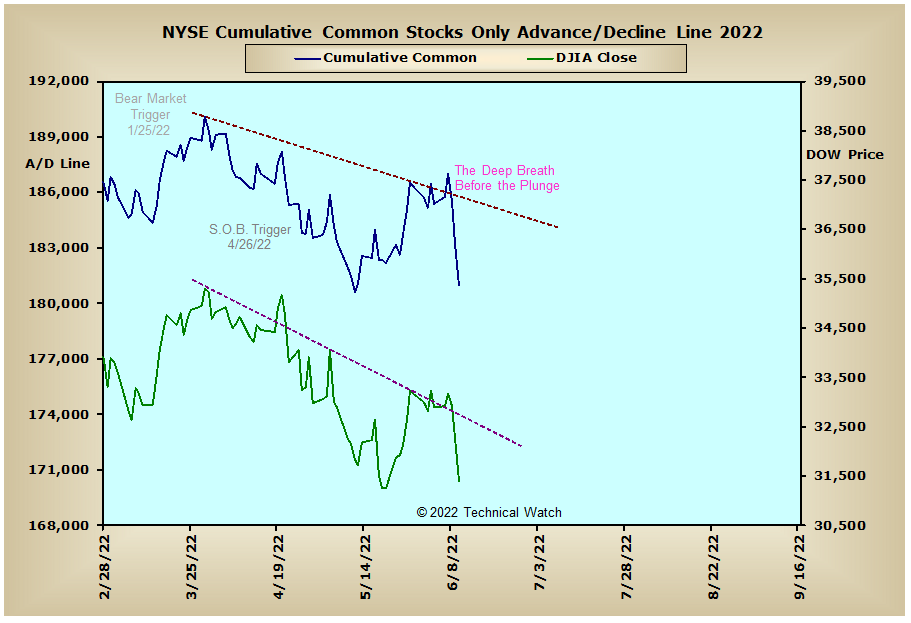
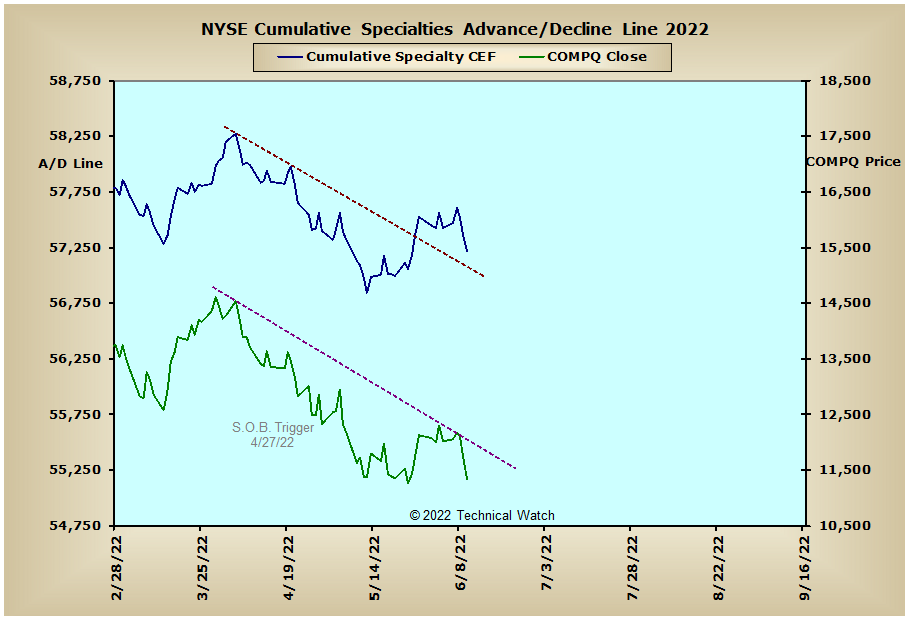
After continuing to consolidate in and around their respective 20 and 50 day EMA's early in the week, the buyers lost control on Thursday and into Friday with index declines, once again, evenly distributed. At the closing bell on Friday, the major market indexes finished with an average loss of -4.78% for it's worse trading week since the week ending January 21st where the average loss was -6.15%.
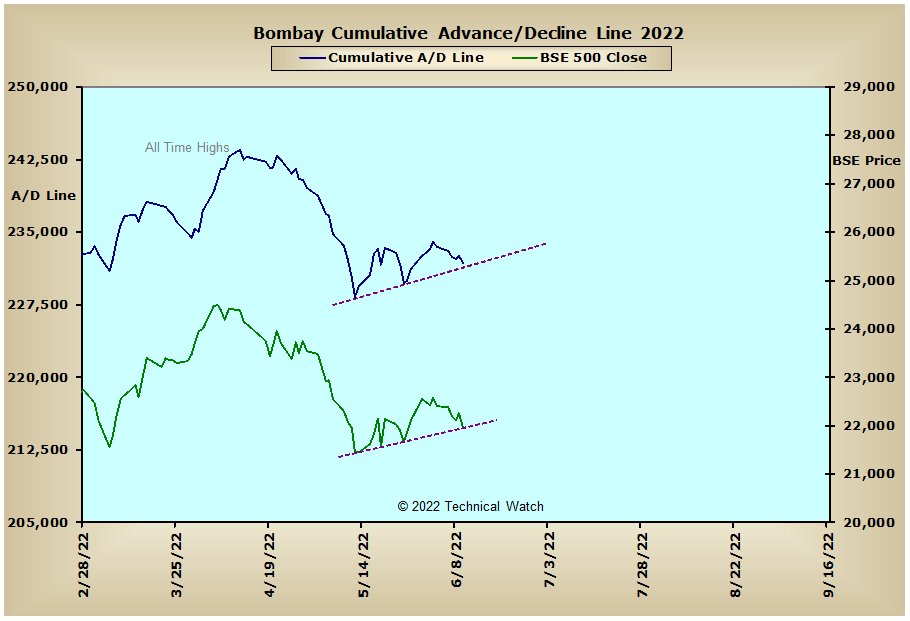
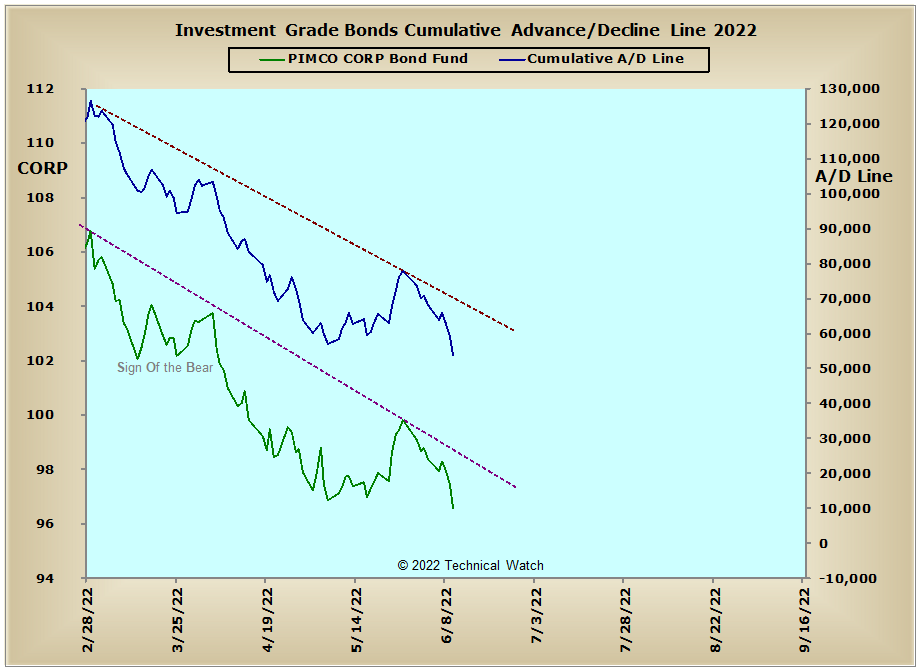
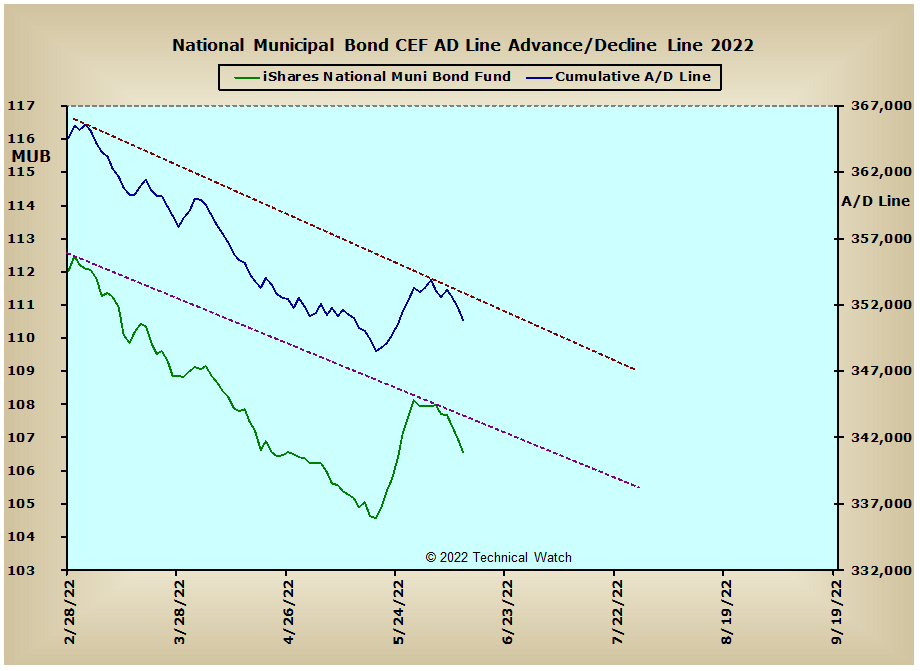
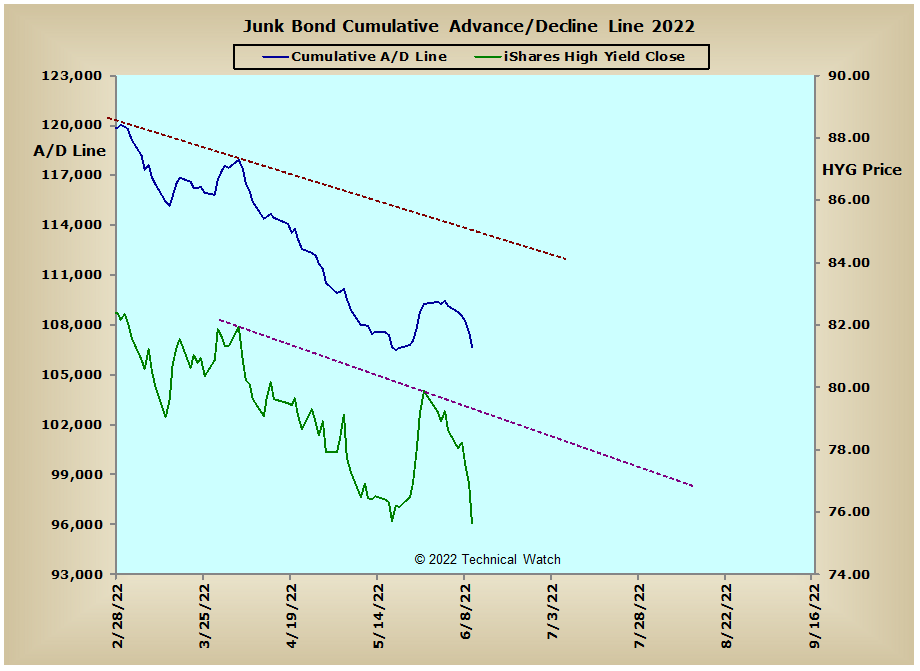
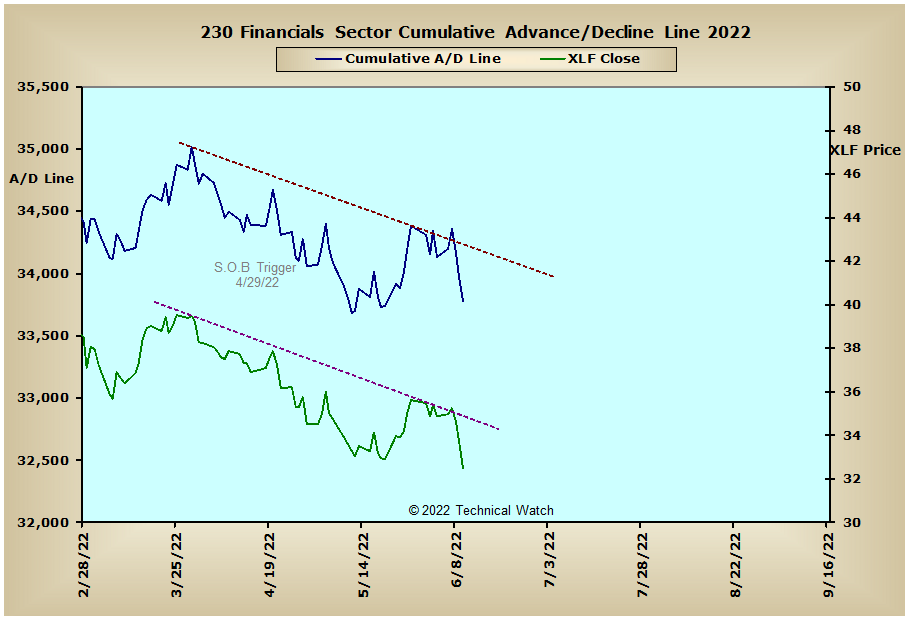
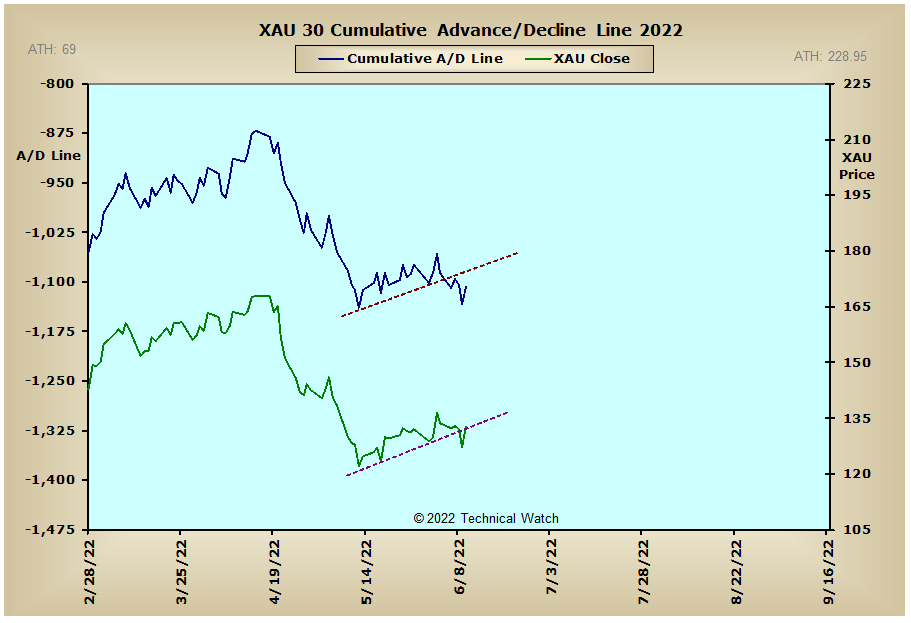
Looking at our re-scaled array of cumulative breadth charts for this week shows that Friday's collapse in equity prices generally moved too far and too fast from where prices will likely "reset" to fill the vacuum created by such events early next week. This also includes the interest rate sensitive money flow charts, although, the Investment Grade Bond advance/decline line is leading CORP prices to the downside at this time. We also see that the Precious Metals advance/decline line also broke multi week support this past week though the price of gold defied this directional flow of money, no less a stronger U.S. Dollar (+1.95%), by finishing higher by +1.37%. The energy sector also slipped a bit with the general market weakness though the price of WTIC did close higher for its 3rd straight week in a row and the seventh time in the last nine. Looking overseas, and Australia's Old Ordinaries advance/decline line continues to make new all time lows on a daily basis, while the Bombay advance/decline line closed on its multi week line of support to finish out the week.
So with the BETS moving sharply lower to a reading of -60, both traders and investors continue to work with a hostile market environment. To no ones real surprise, we start the week ahead with all of the breadth and volume McClellan Oscillators in negative territory. As we move forward, any break below the early May MCO lows will then allow prices to take out their May bottoms and any bullish divergences noted last month in several McClellan Summation Indexes. With the OEX breadth MCO, the SPX volume MCO and both the Dow breadth and volume MCO's already below these same levels on Friday, we should now expect the other MCO's to do the same as soon as next week. Critical support then becomes the MCO lows of January where, if taken out, will likely set off a cascading effect in prices to the downside...in Elliott Wave terms, the infamous 3 of 3 center point event which would eventually include new lows for the year in all of the breadth and volume McClellan Summation Indexes. Aside from next week's 2nd quarter quadruple expiration of futures and options, we also have to work around this coming Wednesday's FED policy statement where the CME's FED Watch Tool now shows that the percentage chance of a half point increase has dropped from 98% on June 3rd to 59%, while the chances of a 3/4% rate increase has gone from 5% to a 40% chance. Another sour note for the bulls as we start the week ahead is that the price of a Bitcoin, which has been joined at the hip with equities since the yield on the 10 year note moved above 1.80% in January, is currently in the process of breaking longer term support at $29,000, with any close below $28,000 finishing off a major longer term topping formation. With all this as a backdrop then, the week ahead could be quite volatile as technicians and fundamentalists battle to keep things buoyant going into this week's OPEX period. Trading strategy wise, and outside of any near term snapback attempts back up to or toward recent MCO zero line violations, let's continue to have a bearish bias in our trades, with any sharp daily decline of more than 7-10% providing a selective exit point for already opened short positions.
Have a great trading week!
US Interest Rates: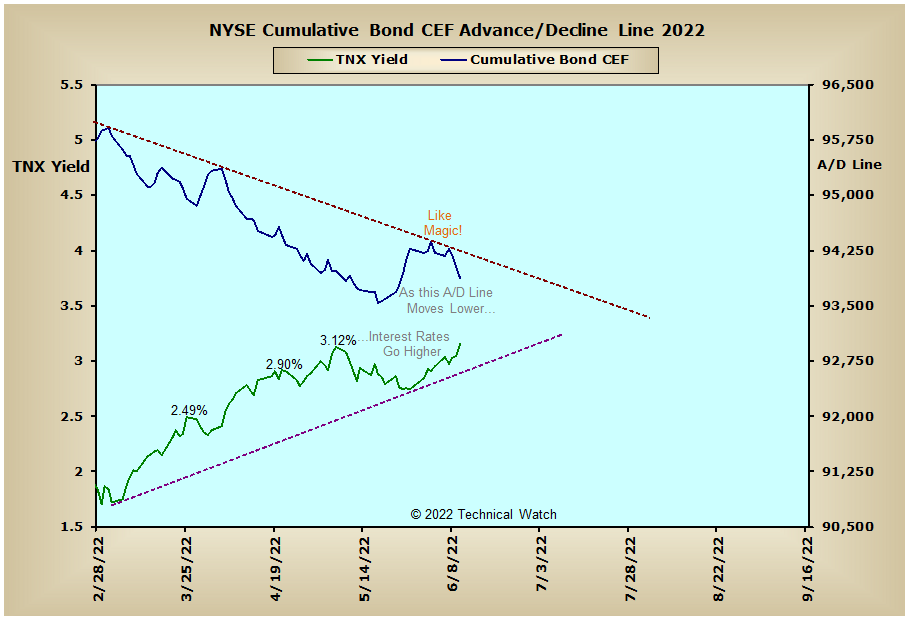
US Sectors: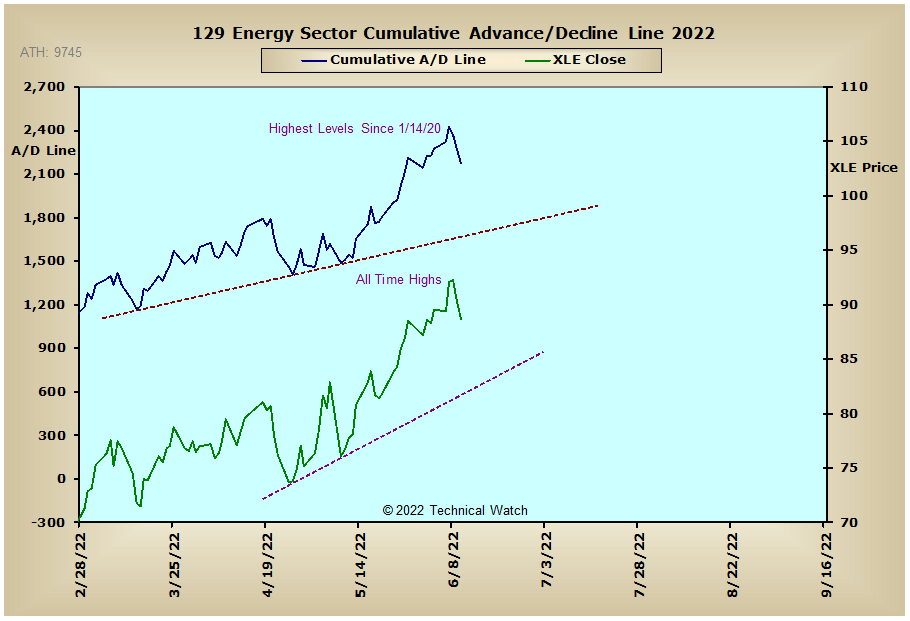

Precious Metals: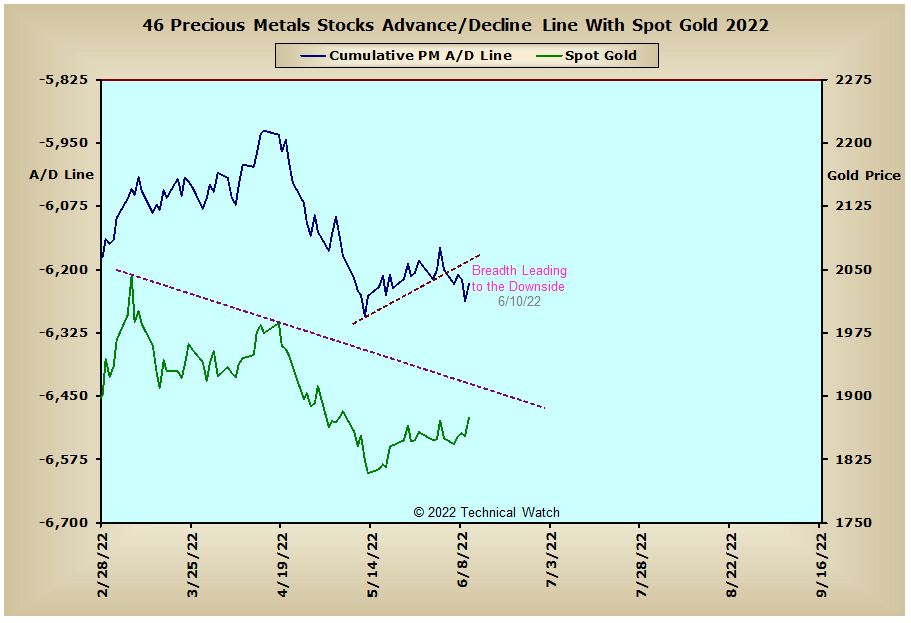
Australia: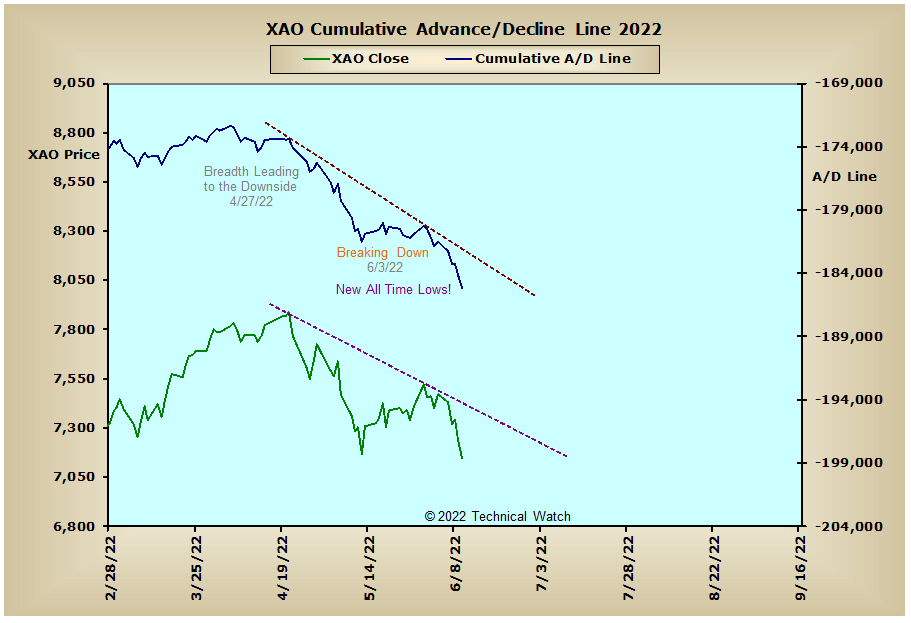
England: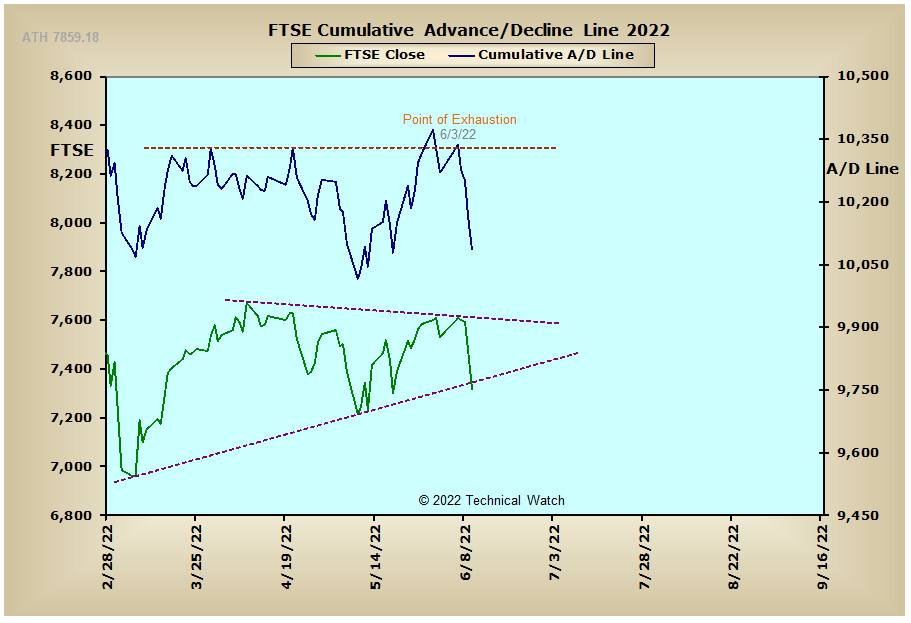
France: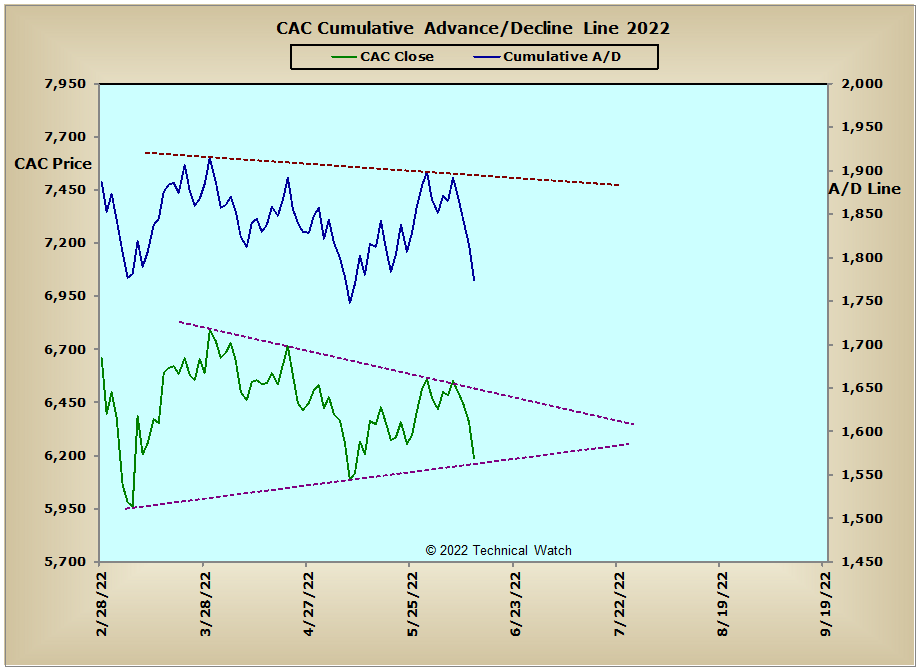
Germany: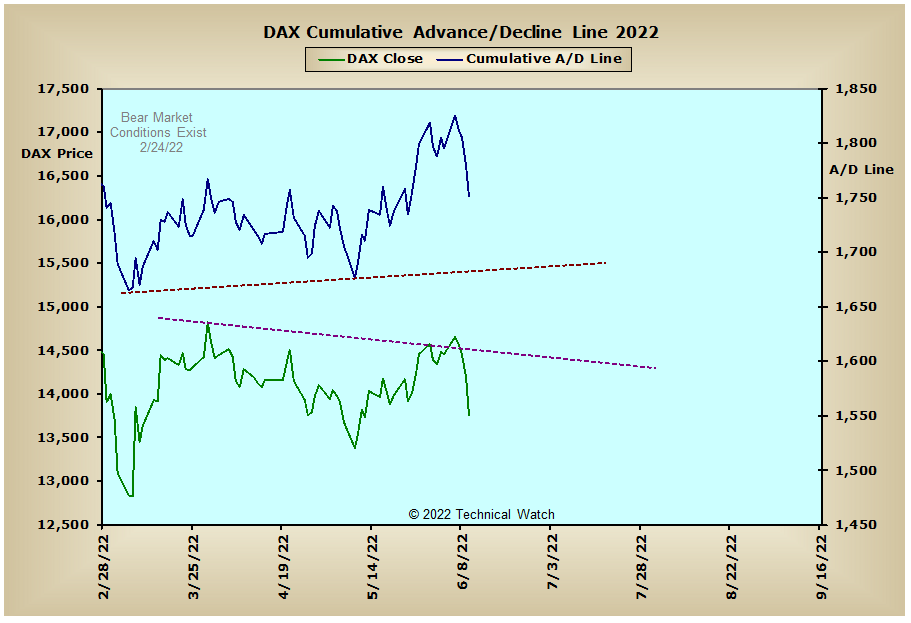
India: