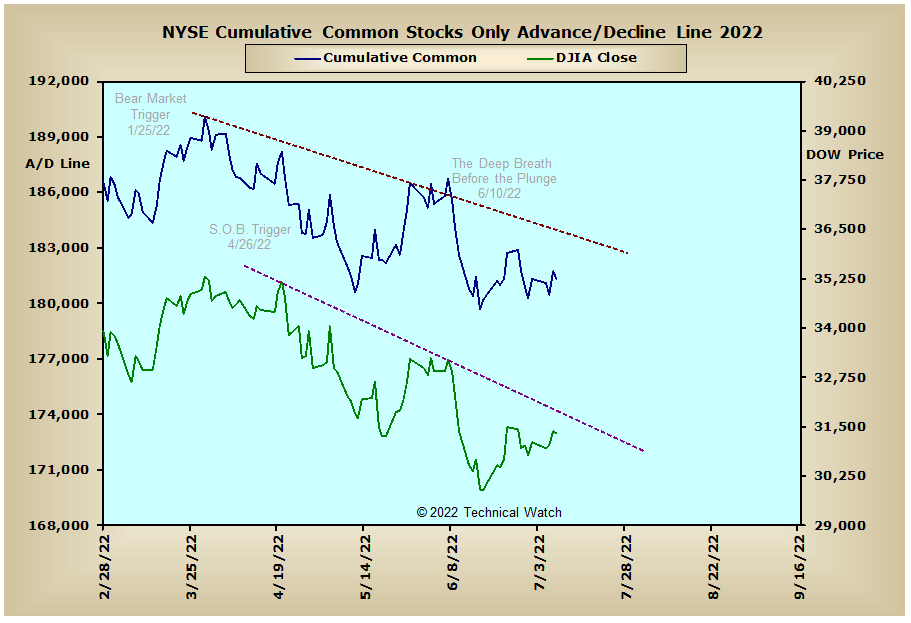
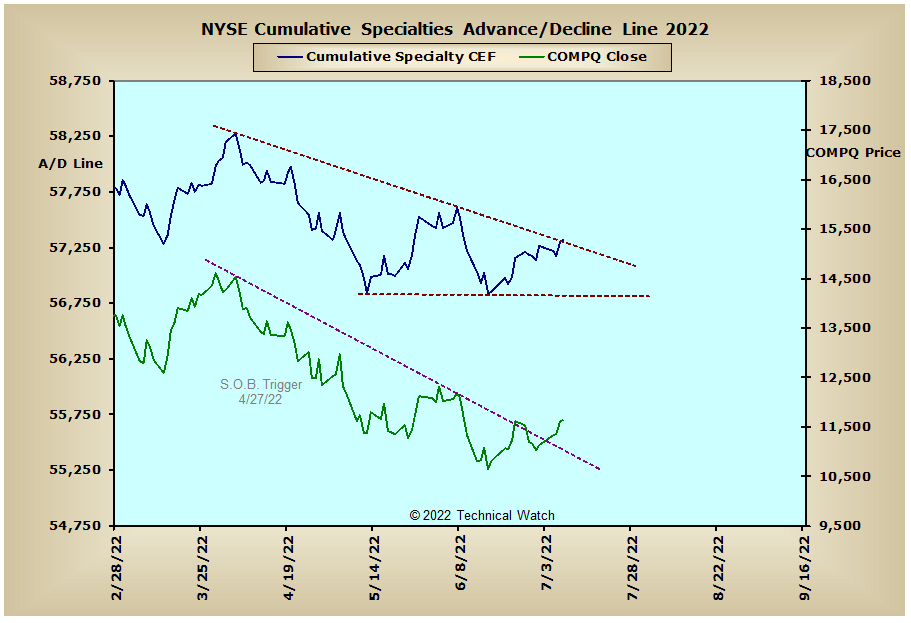
Stock prices drifted higher last week with the Dow Industrials (+.77%), S&P 500 (+1.94%) and NASDAQ Composite Index (+4.56%) setting the pace which included finishing above their respective 20 day EMA's as the total basket closed with an average weekly gain of +1.64%. Weekly average volume slowed to its lowest levels since the end of last year as index prices continue to trade just above their important 200 week EMA's.
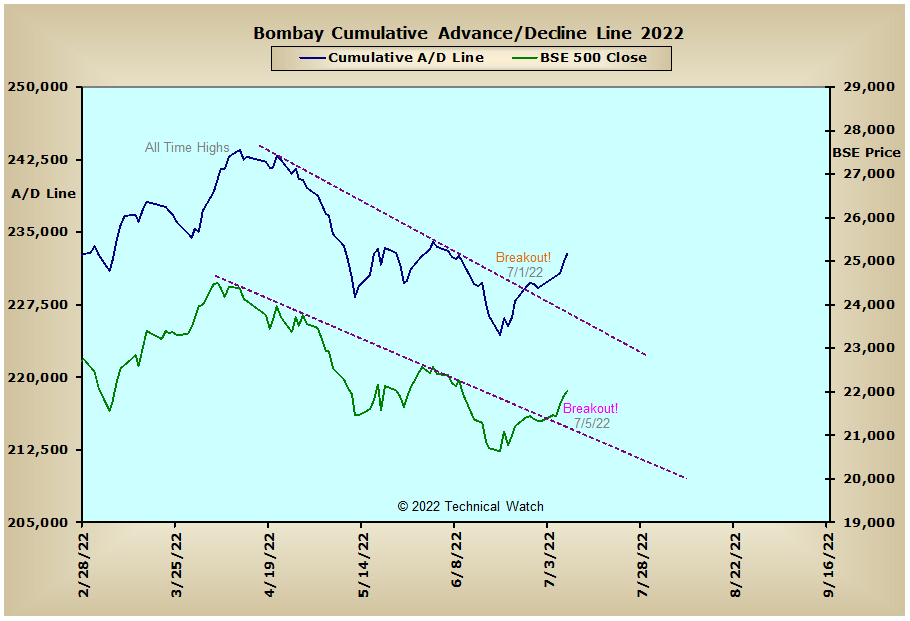
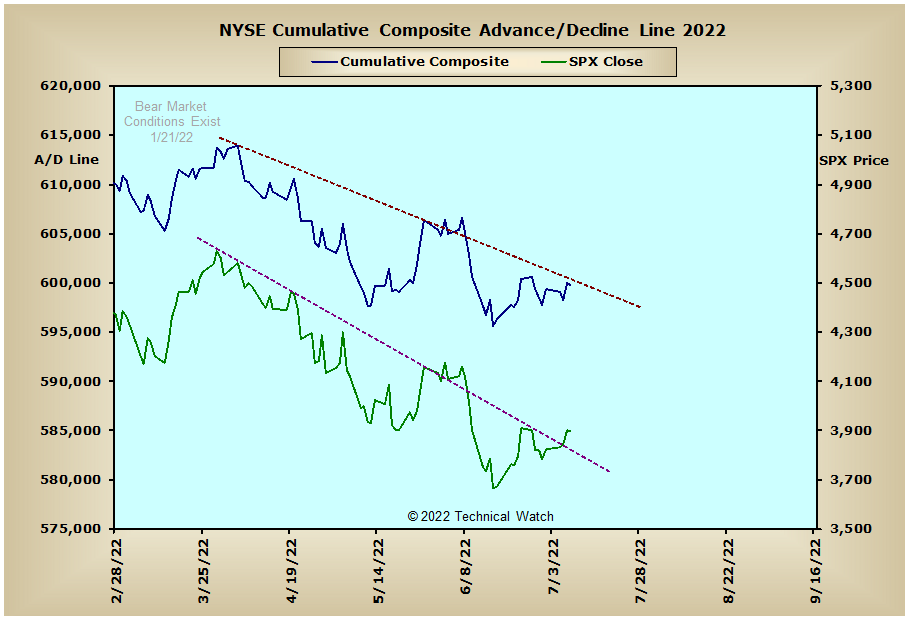
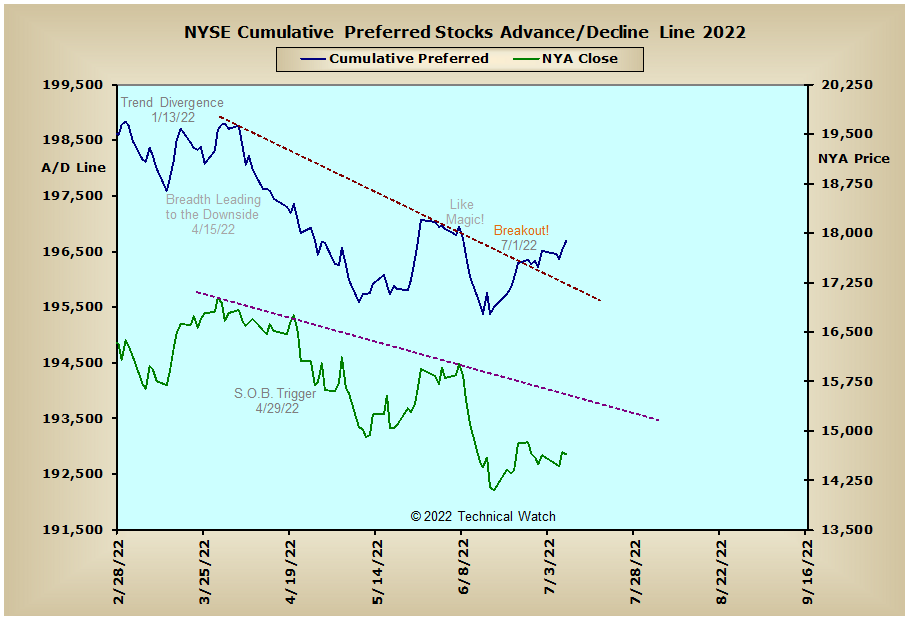
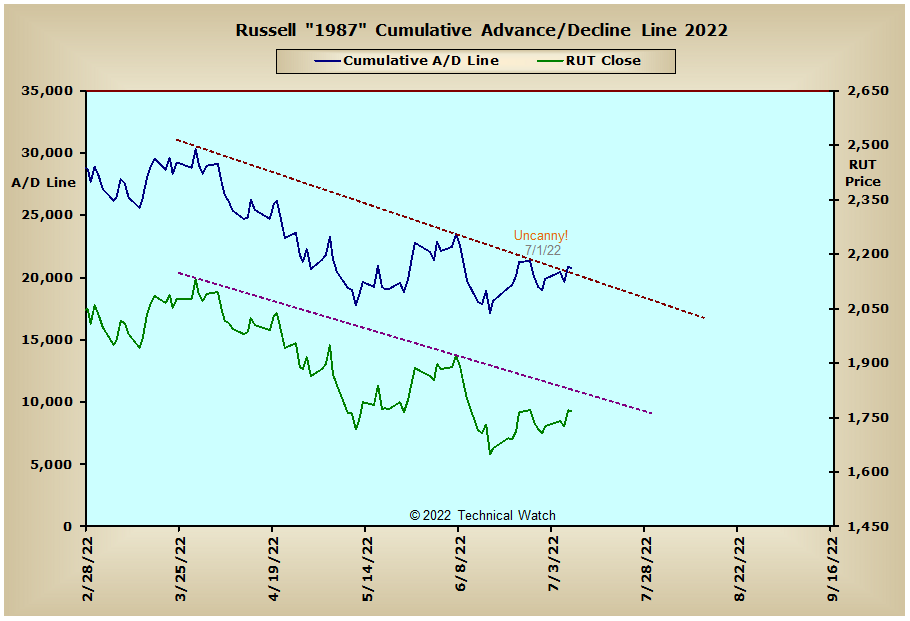
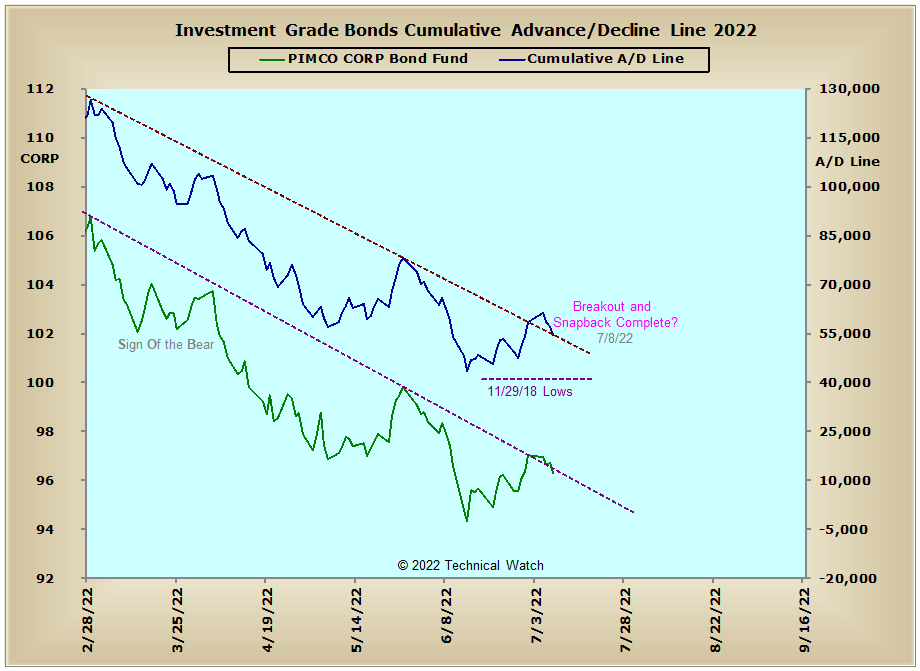
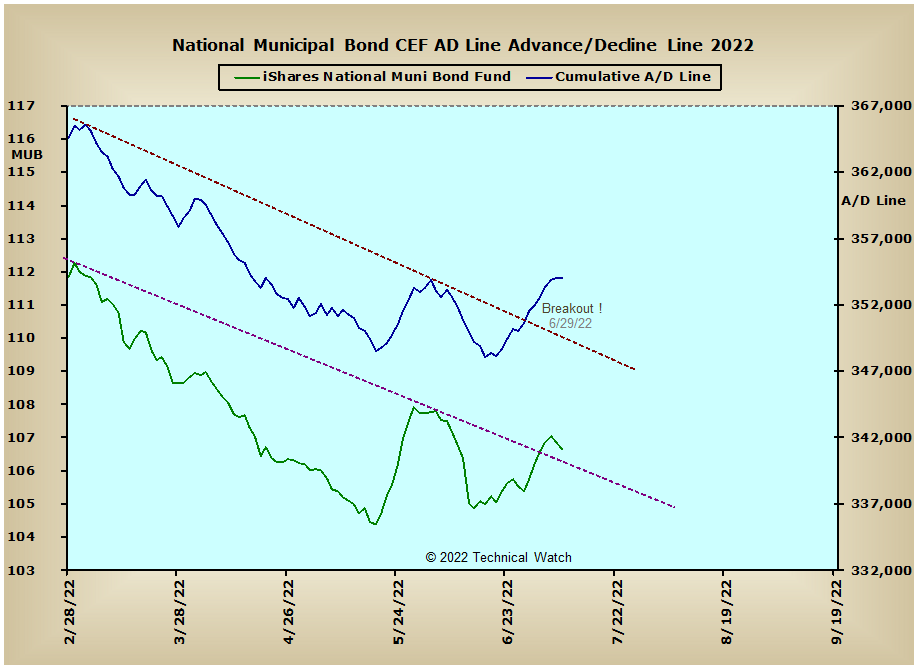
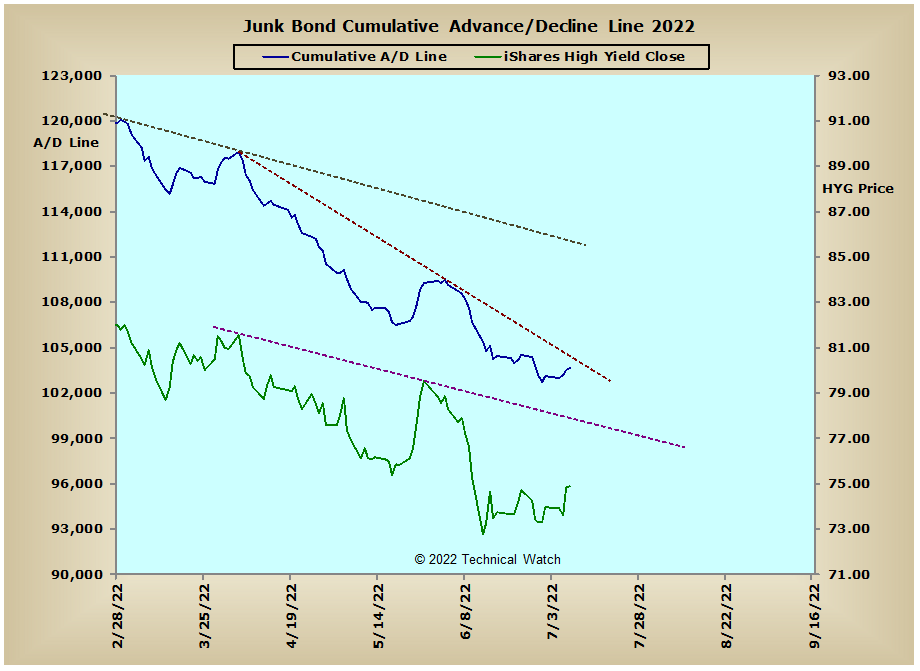
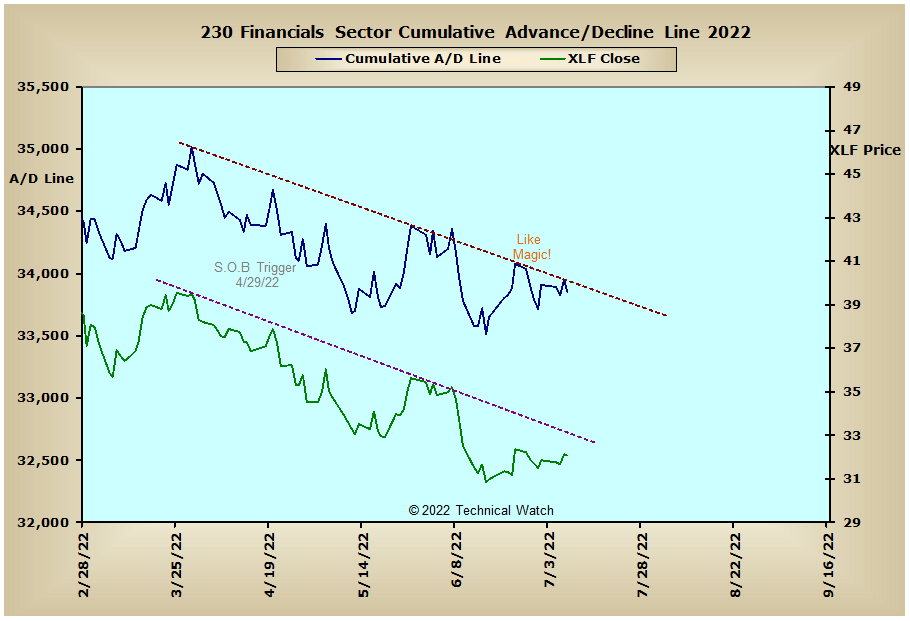
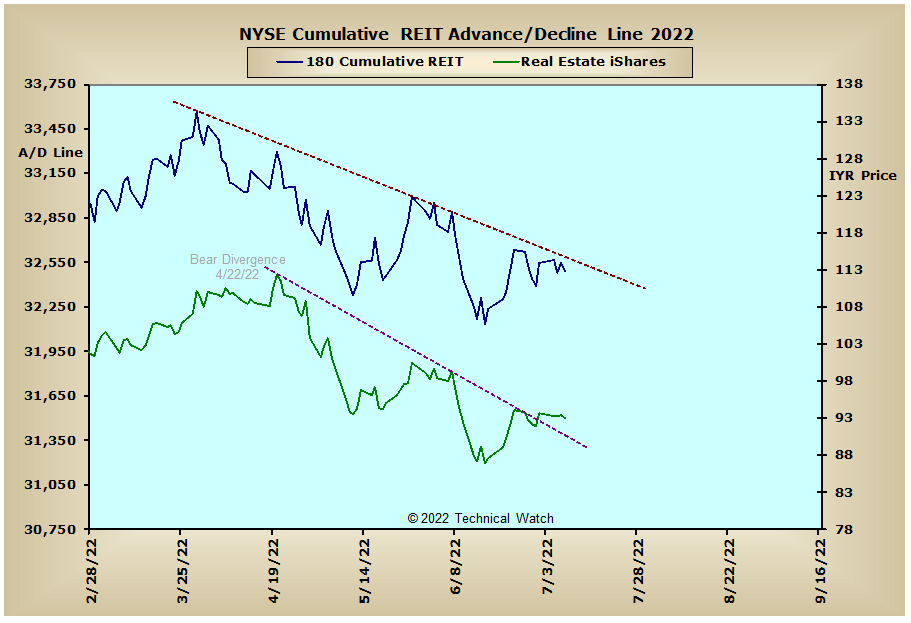
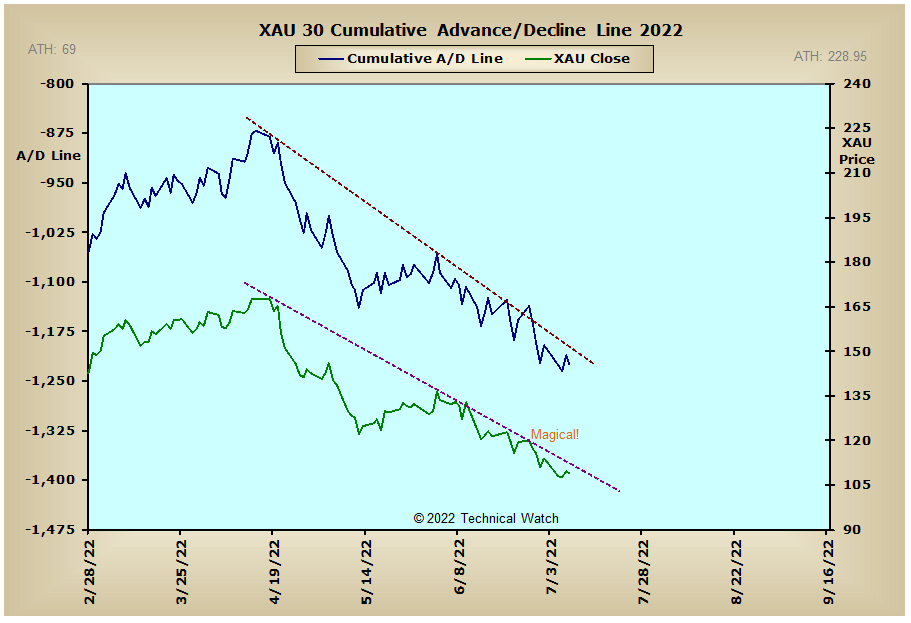
Looking at this week's standard array of cumulative breadth charts shows that the majority of the interest rate sensitive A/D lines continued to improve on their recent bullish behavior to the point where the NYSE Composite advance/decline line closed just below its intermediate term declining tops line that goes back to early April. Further improvement in this area by the bond/note bulls would expand the current trading ranges of equity indexes up toward their respective 50 day EMA's as we go into next Friday's July OPEX period. Helping the debt asset class with this latest rally has been the ongoing weakness in the Energy Sector advance/decline line which had a confirmed break of its uptrend on July 5th. Meanwhile, precious metals declined sharply this past week with the price of gold finishing at $1742.30, with both silver ($19.42) and copper ($3.52) finishing below their 200 week EMA's. Meanwhile, international issues continue to be buoyant with India's Bombay advance/decline line also showing some upside follow through after its breakout above its declining tops line from the week before.
So with the BETS bumping to a reading of -60, traders and investors continue to have a bearish bias toward equities. As we start off the week ahead, all of the breadth McClellan Oscillators remain below their July 27th highs where a move above these same levels would be needed to sidestep the potential of developing Sign Of the Bear pattern structures from the early June period. With some of the volume McClellan Oscillators already above their end June highs, this give the buyers a bit more confidence that prices will continue to have a rising bias to them especially if their breadth cousins get with the program. The NYSE Open 10 Trading Index continues to be deeply "oversold" at 1.27, and this is also helping out the bull cause on a near term basis. The 10 day average of put/call ratios continue to suggest that speculators are looking for higher prices as call buying remains strong, while implied put price premiums continue to sag toward their lower Bollinger Bands. Aside from next Friday's OPEX, next week includes the newest inflation numbers for June with the CPI on Wednesday, the PPI on Thursday, with retail sales, industrial production and Michigan consumer confidence on Friday rounding out a very busy week of potential market movers. With all this in the mix then, let's continue with a bearish bias for the week ahead, with any closes on the index price charts above their respective 50 day EMA's suggesting that we may have to retract our collective bear claws for the rest of July.
Have a great trading week!
US Interest Rates: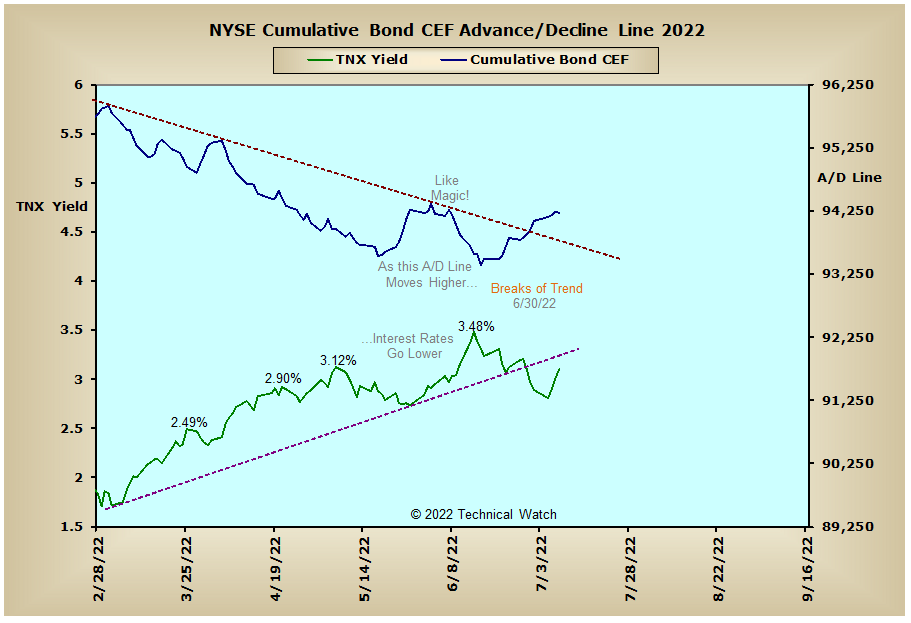
US Sectors: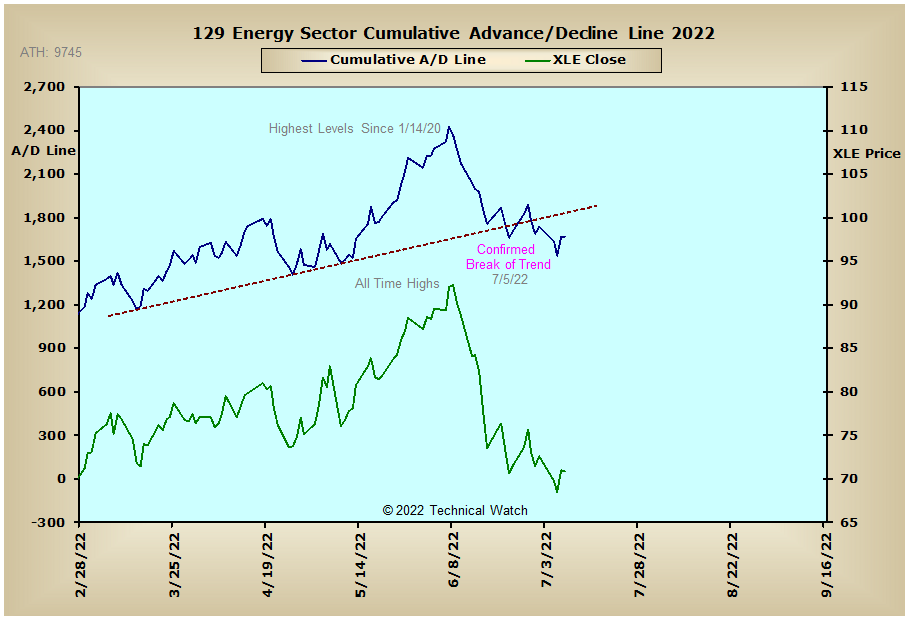
Precious Metals: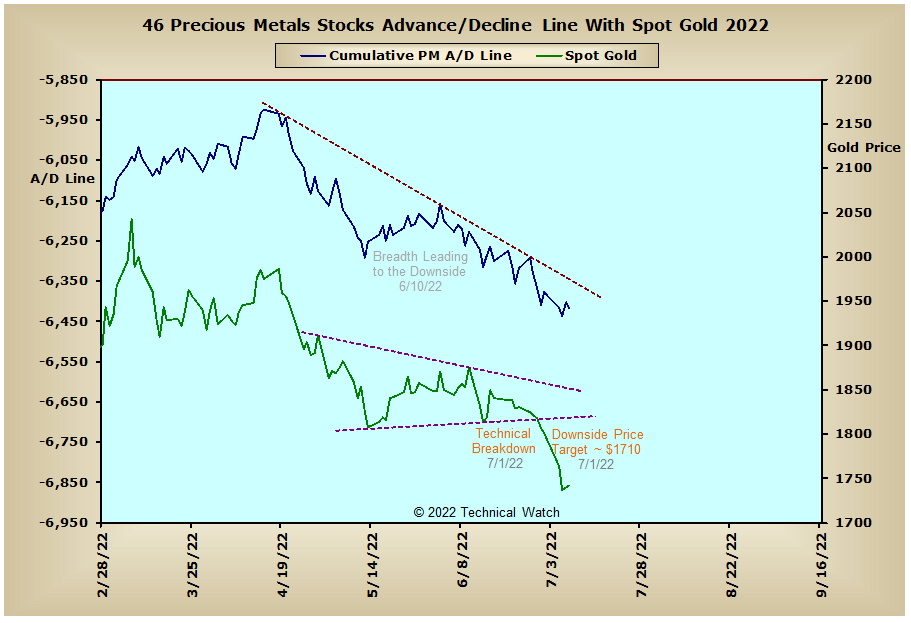
Australia: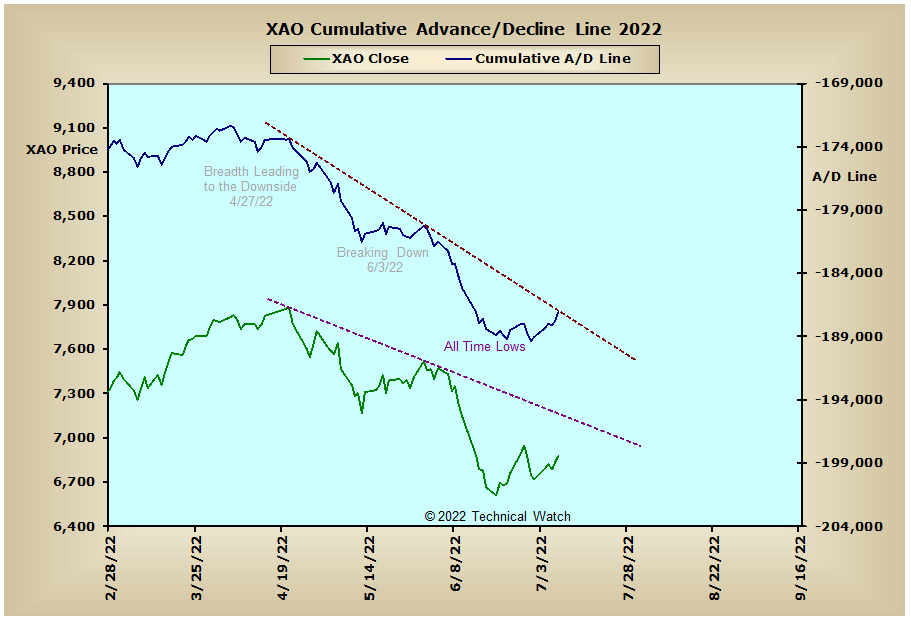
England: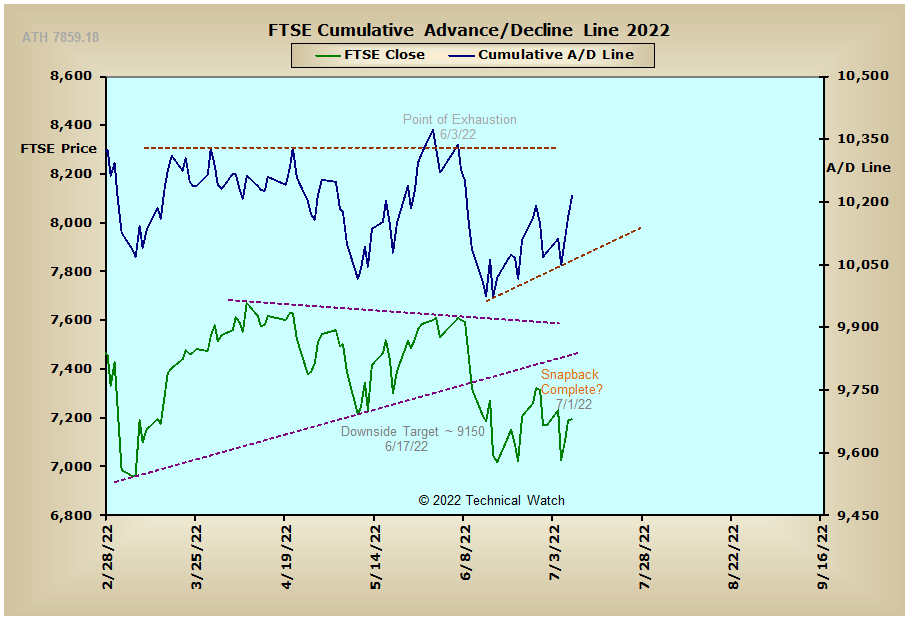
France: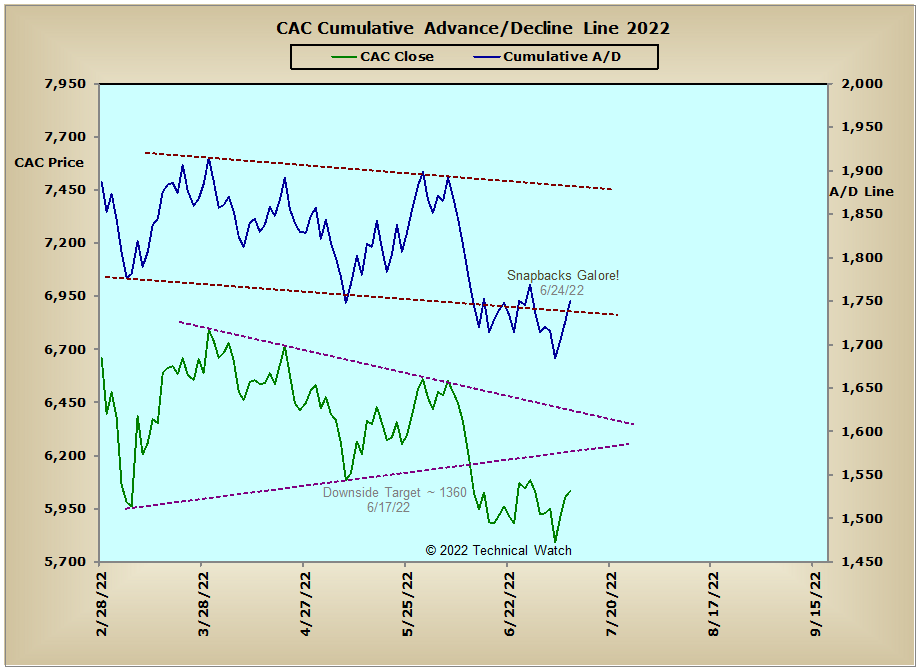
Germany: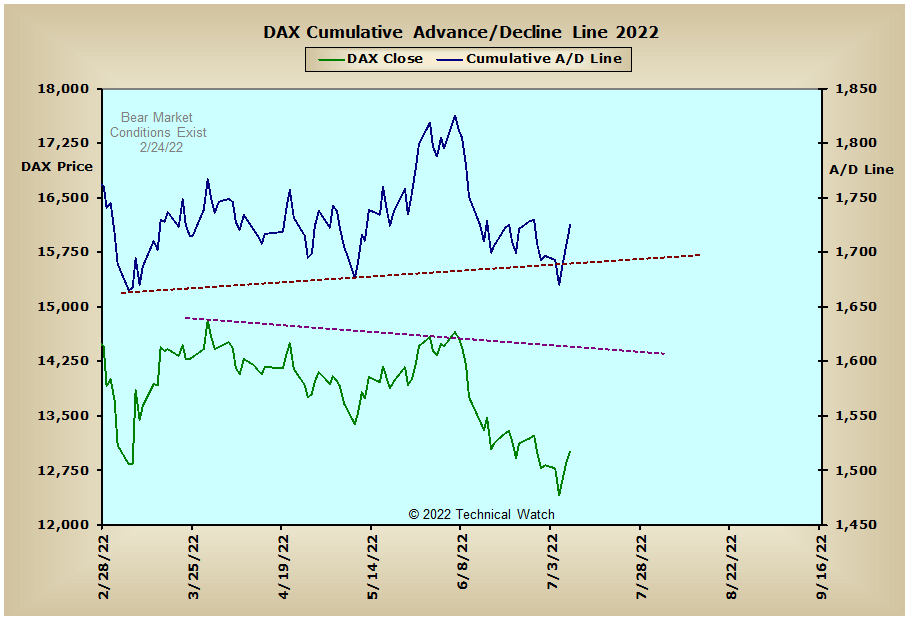
India: