The major market indices sagged lower to or toward their S.O.B. trigger points for much of last week before OPEX Friday turned things around in a big way, and this allowed the equity markets to cut their average weekly losses to only -.88% as prices continue to attempt to find longer term pattern support at their respective 200 week exponential moving averages (also known as the four year economic cycle).
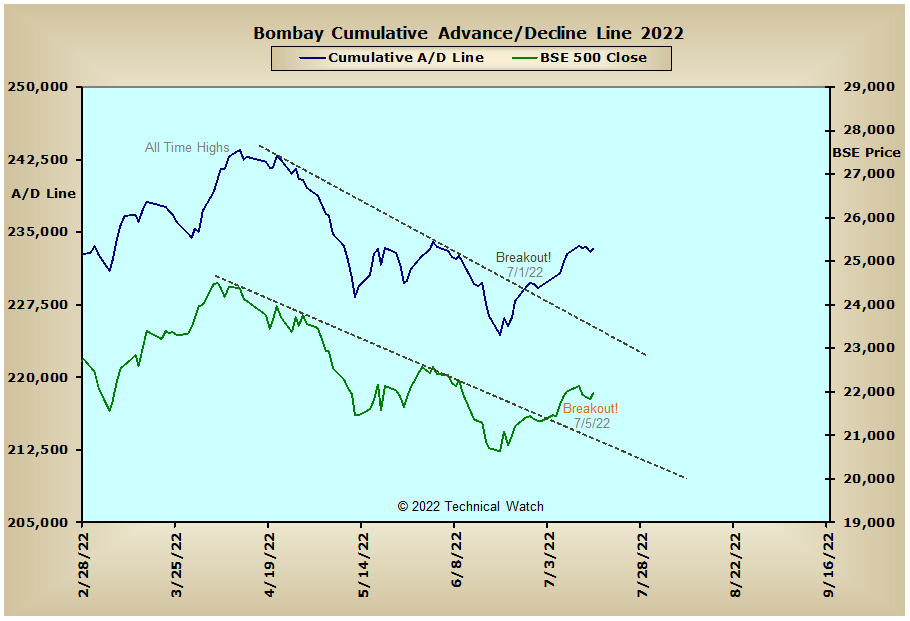
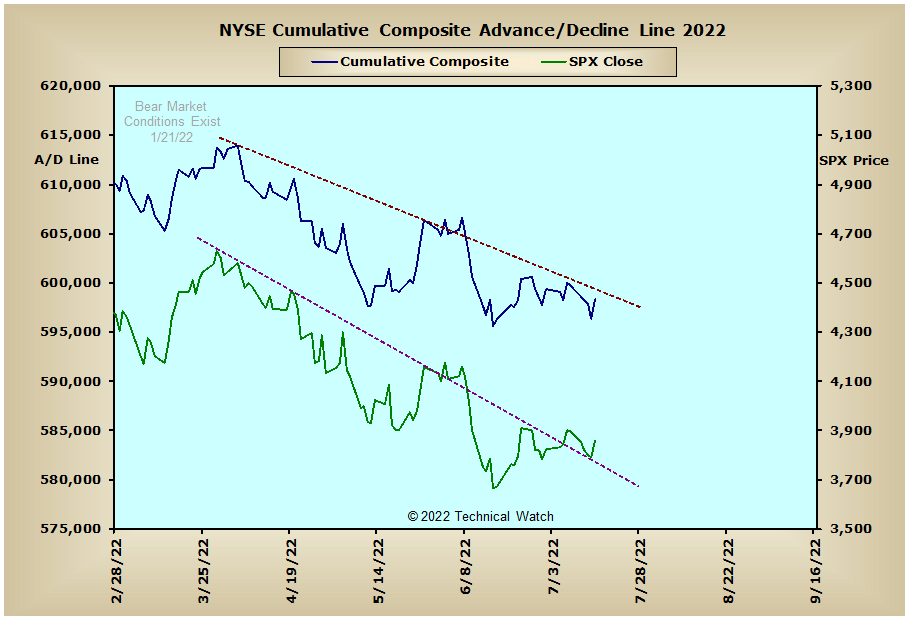
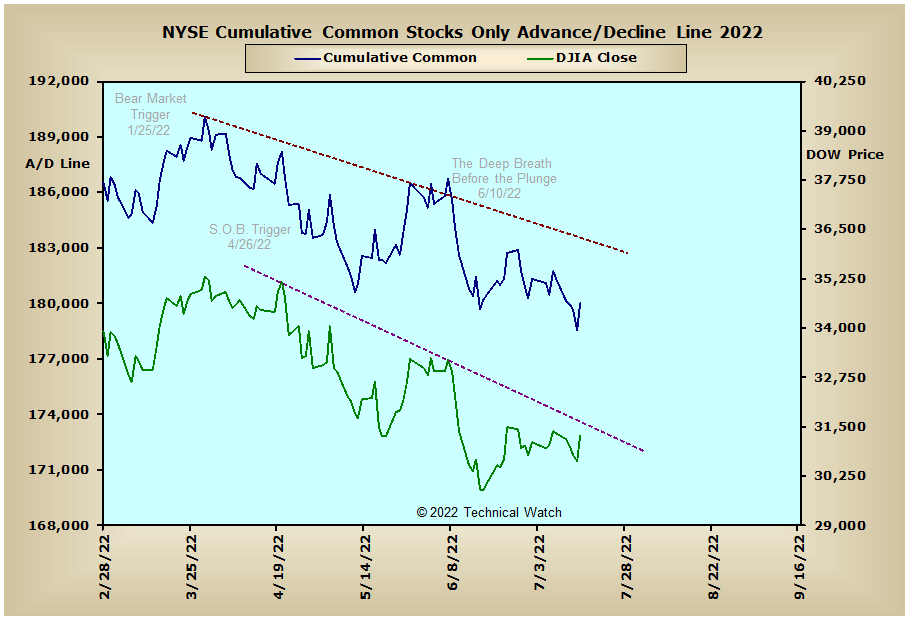
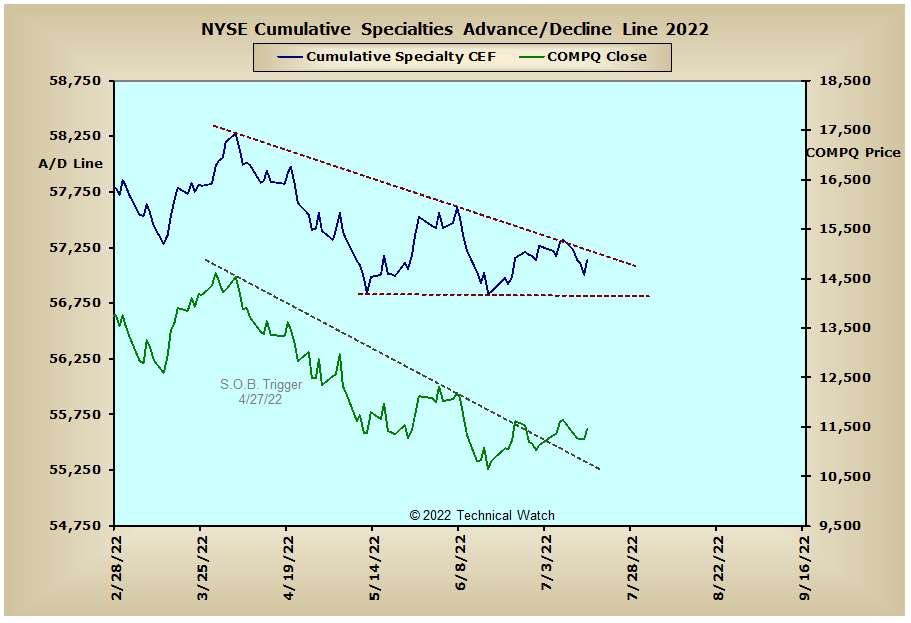
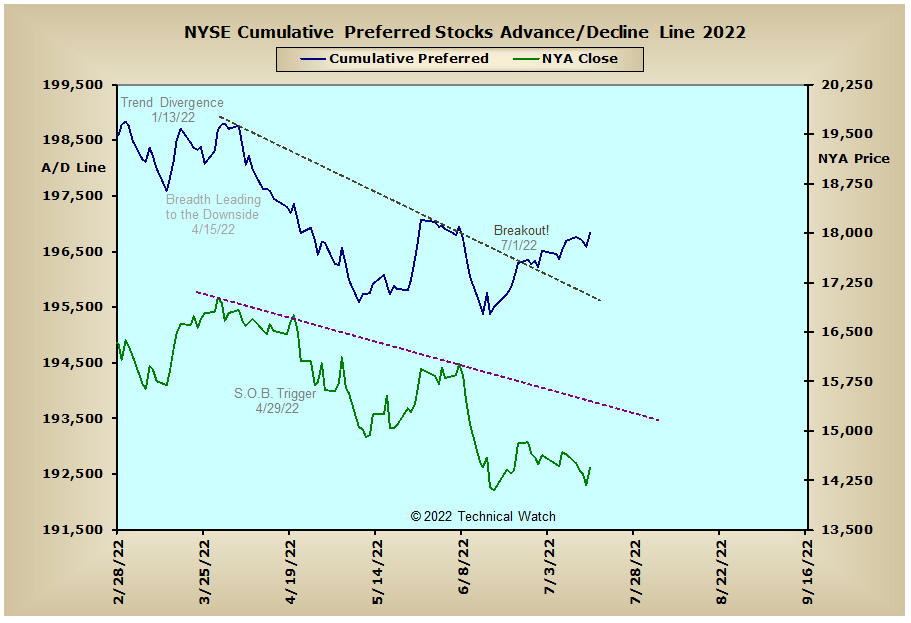
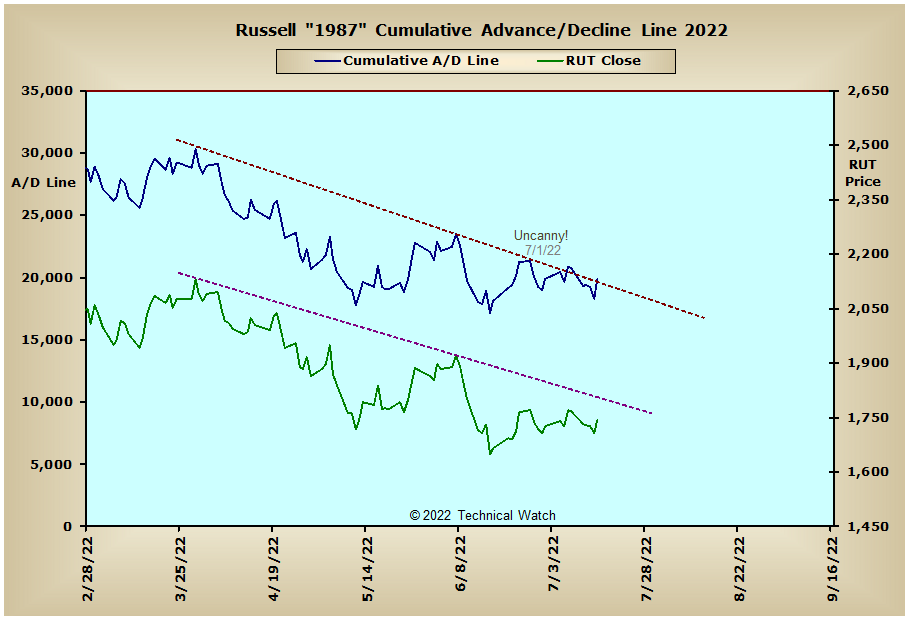
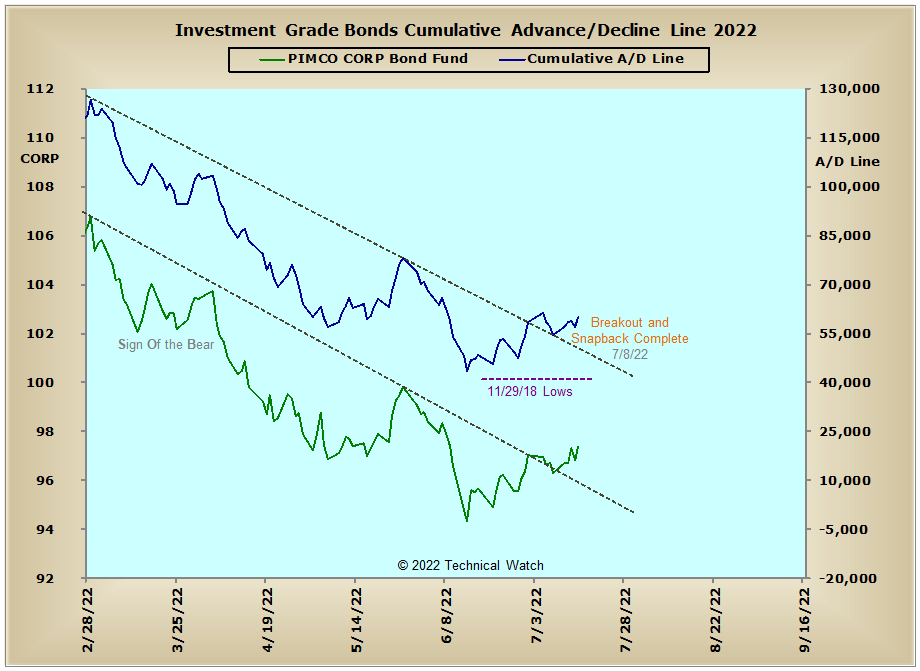
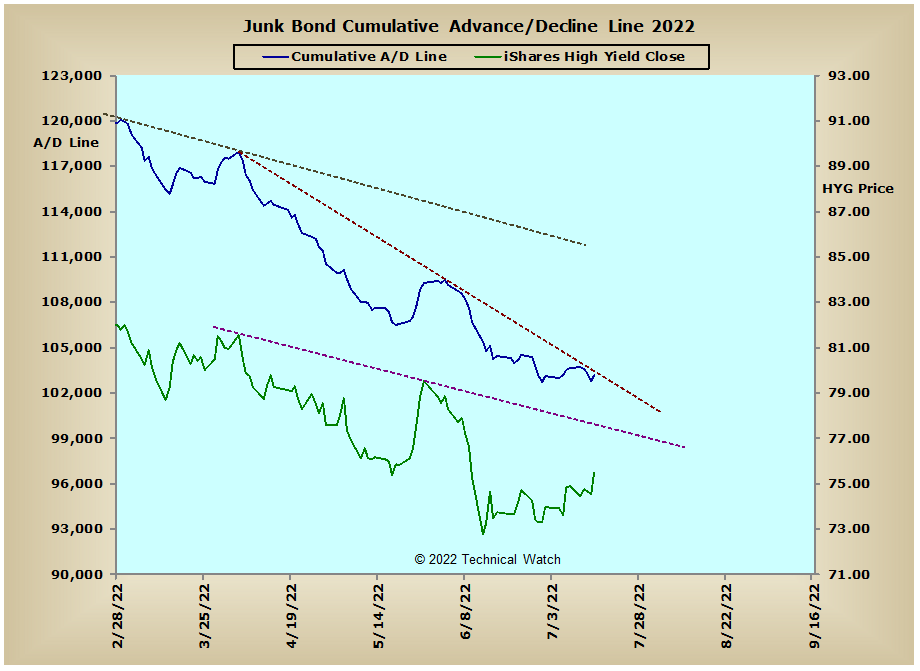
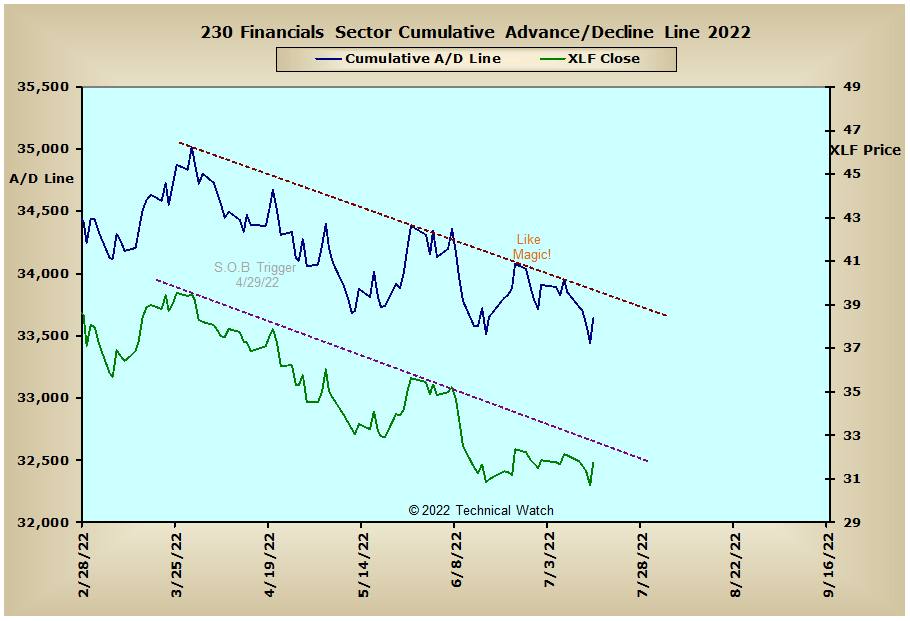
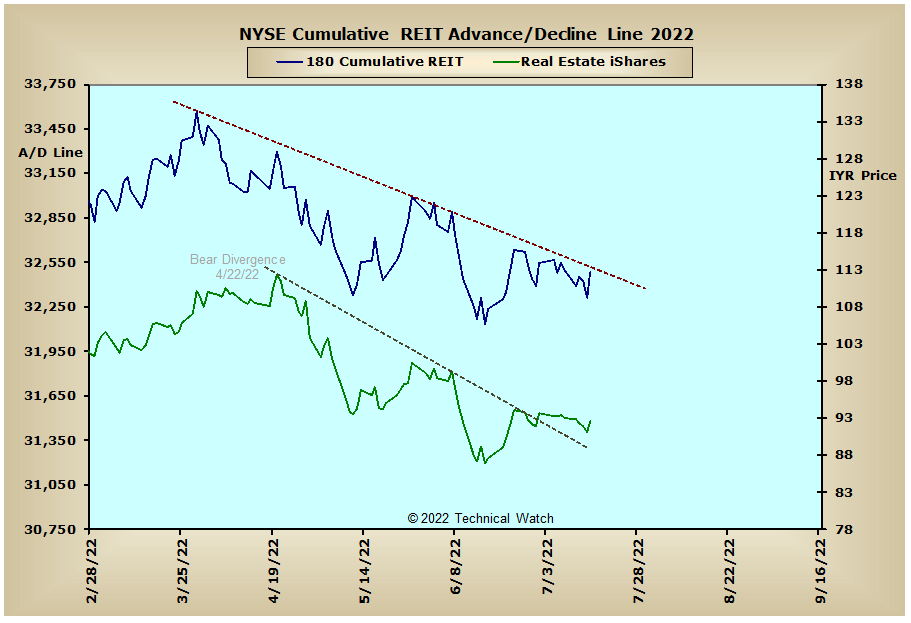
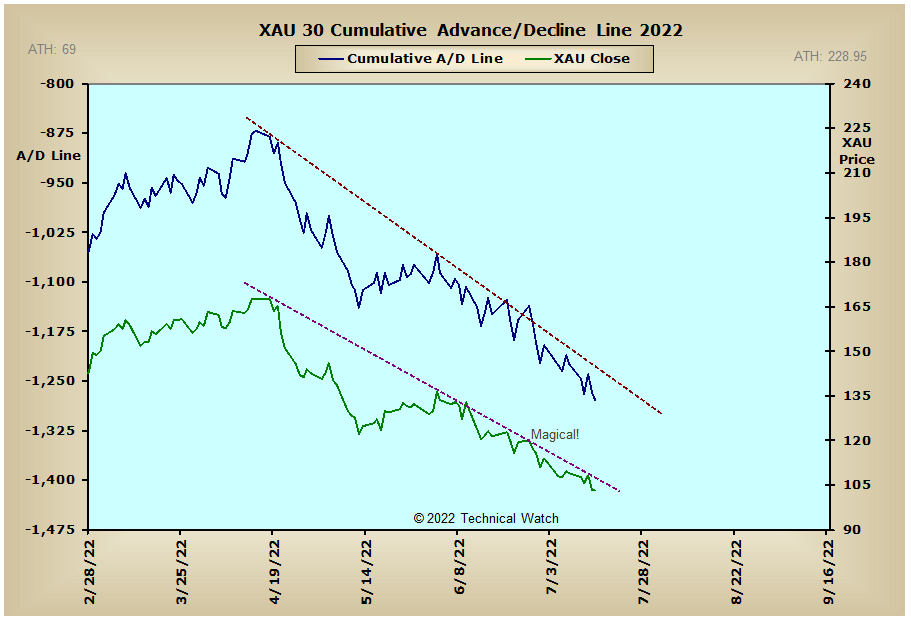
Looking over our usual array of cumulative breadth charts shows very little in the way of analytical changes from the week before though the continued improvement in the NYSE Preferred, NYSE Bond CEF, Investment Grade and Municipal Bond advance/decline lines provided non confirming pattern buoyancy to the NYSE Composite advance/decline line as compared to the NYSE Common Only advance/decline line which moved new reaction lows. This divergence between the broader market and common stocks should give market prices a bit more resiliency in the short term to help work off the deeply "oversold" readings we've grown accustomed to in the NYSE Open 10 Trading Index over the last several weeks. Both the Precious Metals and XAU advance/decline lines continue to show heavy selling pressure as the minimal downside price objective for the price of gold was met late in the week. Looking overseas and we see that the Aussie advance/decline line is still under the influence of its intermediate term declining tops line, the CAC, DAX and FTSE advance/decline lines remain in a state of volatile flux, while the Bombay advance/decline line continues to improve upon its upside breakout that was made back on July 1st.
So with the BETS finishing the week with a reading of -70, traders and investors continue to have a larger bearish bias toward equities as we go into the end of July. As we start the week ahead we see that the majority of the breadth McClellan Oscillators finished on Friday in and around their zero lines, while there was spotty improvement in the volume MCO's with the NDX volume MCO actually finishing at new reaction highs. This has now pushed the NDX volume McClellan Summation Index to just below its longer term declining tops line on Friday where short term momentum should produce an upside breakout as soon as Monday. The Open 10 TRIN's continue to be split between the NYSE maintaining a deeply "oversold" reading of 1.27, while the NASDAQ continues to be "overbought" at .72. The 10 day average of put/call ratios continues to support speculative call buying, while put option implied volatility readings are back to levels that were last seen at the beginning of June. With such a high degree of indecision, prices are likely to continue to be locked in low level consolidation patterns (trading ranges and symmetrical triangles) for the week ahead as traders and investors try to convince each other of their opinions. Because of this, let's go ahead and take more of a neutral directional stance toward prices as trading begins on Monday, while at the same time, any short term pattern breakouts will still have a larger weighting toward the downside.
Have a great trading week!
US Interest Rates: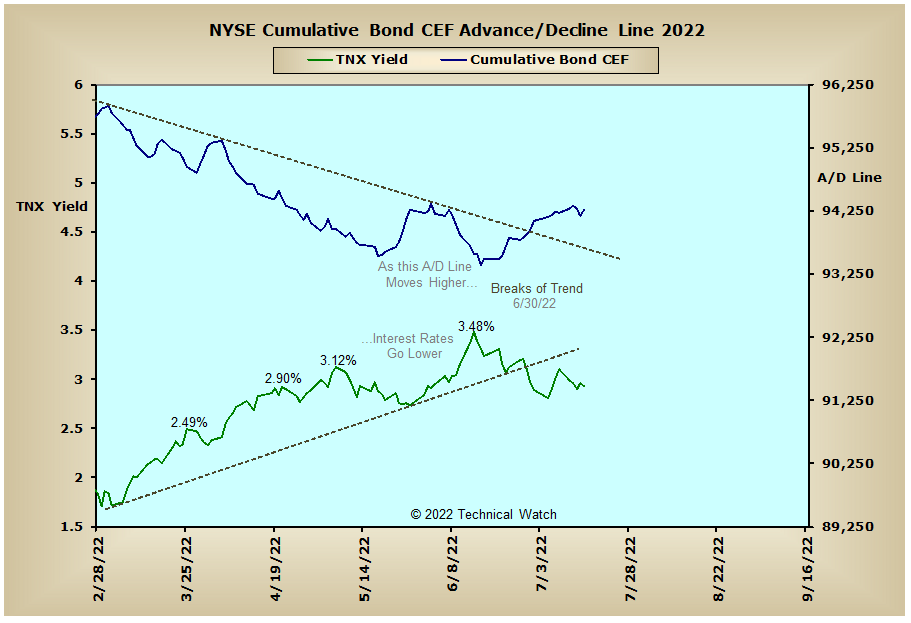

US Sectors: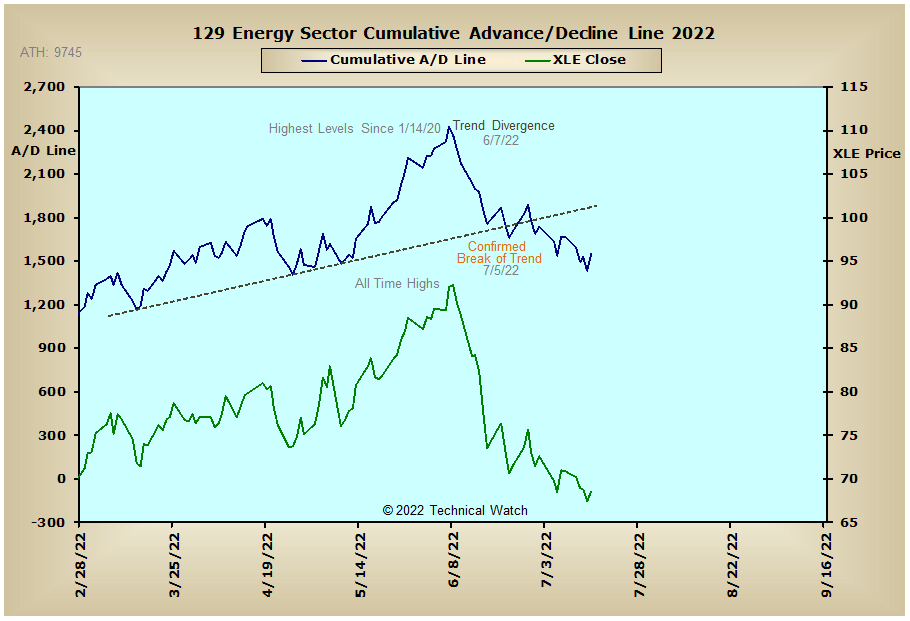
Precious Metals:
Australia: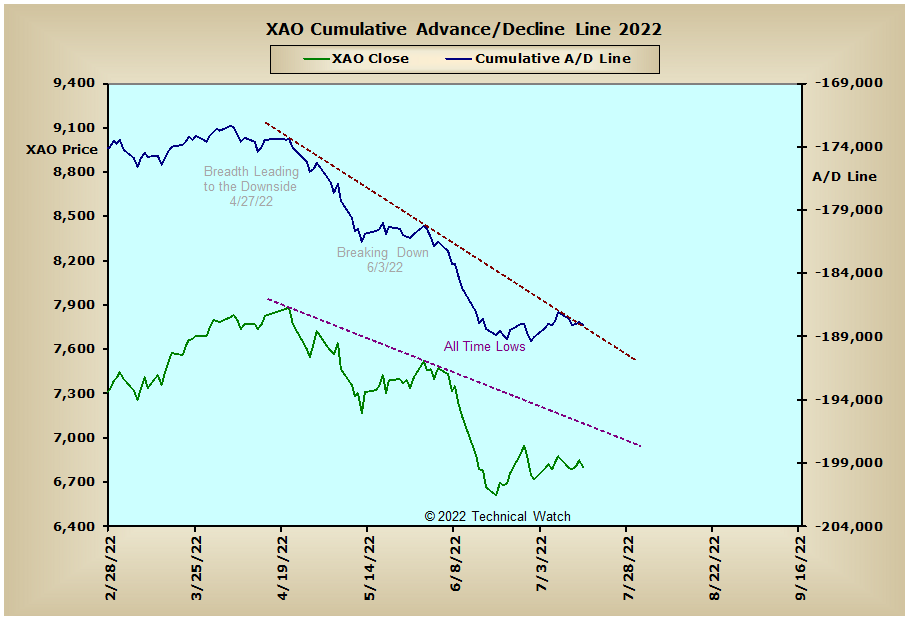
England: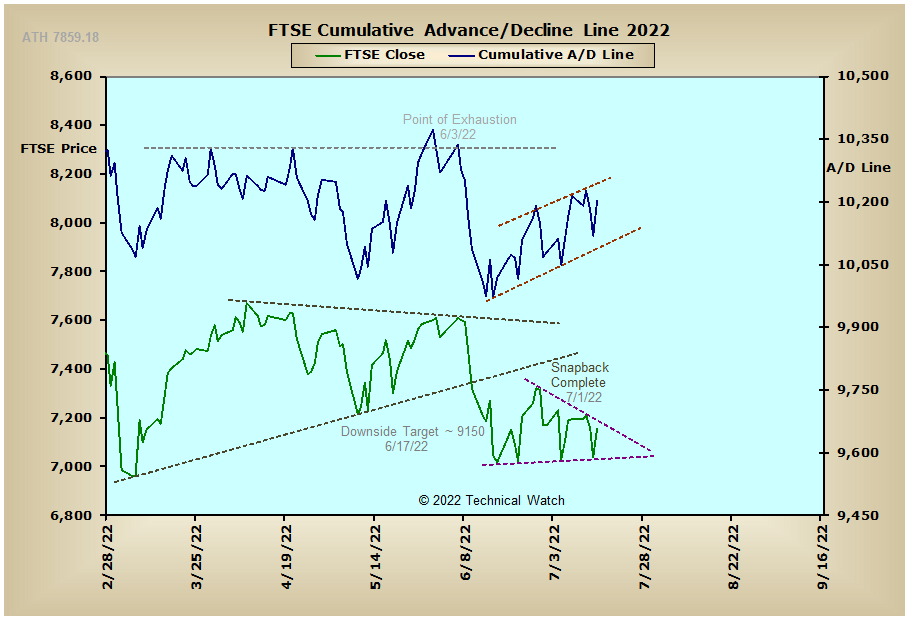
France: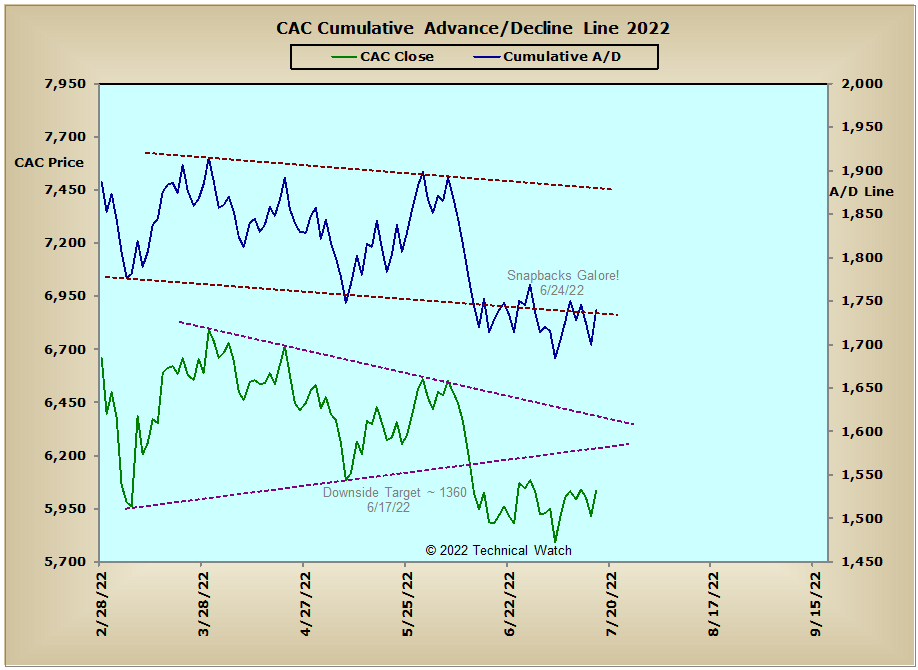
Germany: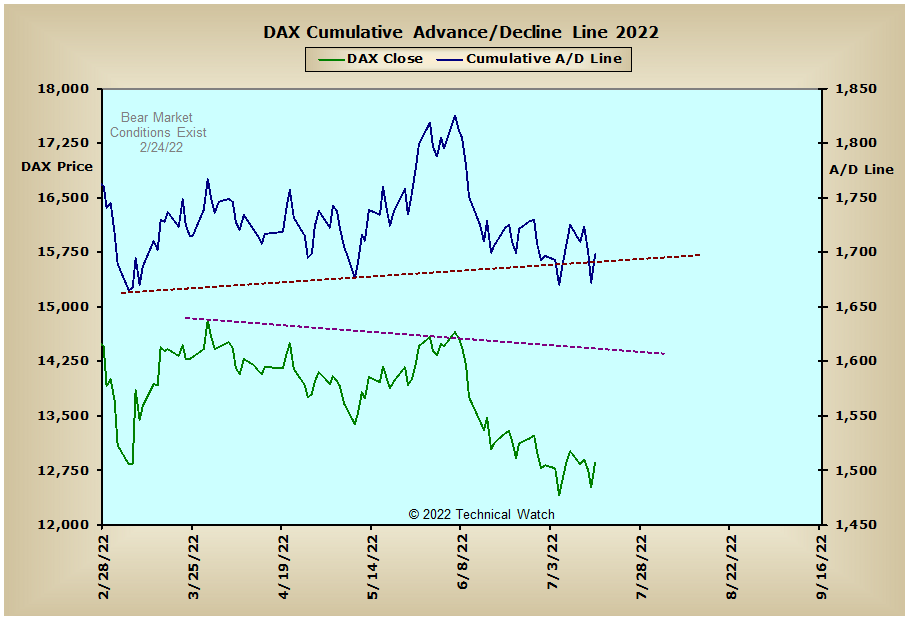
India: