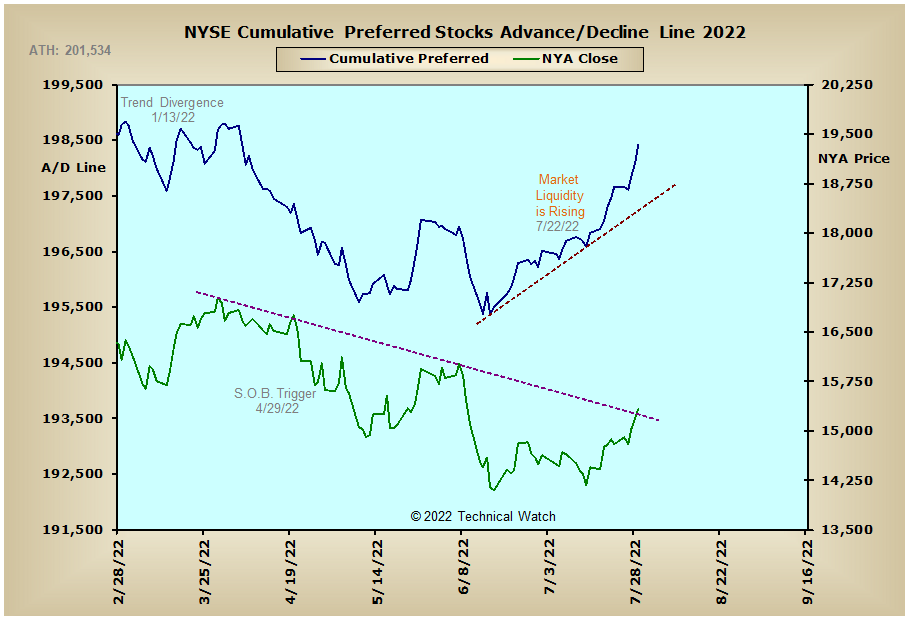
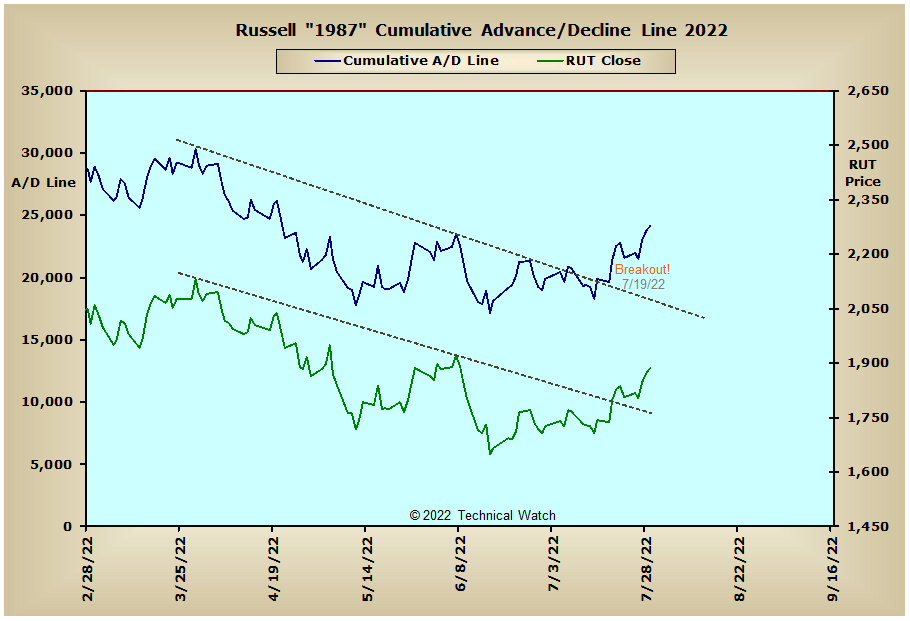
The major market indices added on to the 3% rally from the week before with another strong showing of recovery, primarily on Thursday and Friday, to finish an average gain of +4.17%. Market gains were evenly distributed between value and growth issues with the S&P 400 Mid Cap Index coming out on top as it recaptured another +4.84%. For the month of July itself, equity markets saw an average gain of +9.11%...the largest average monthly gain since November of 2020 which came in at +13.20%.
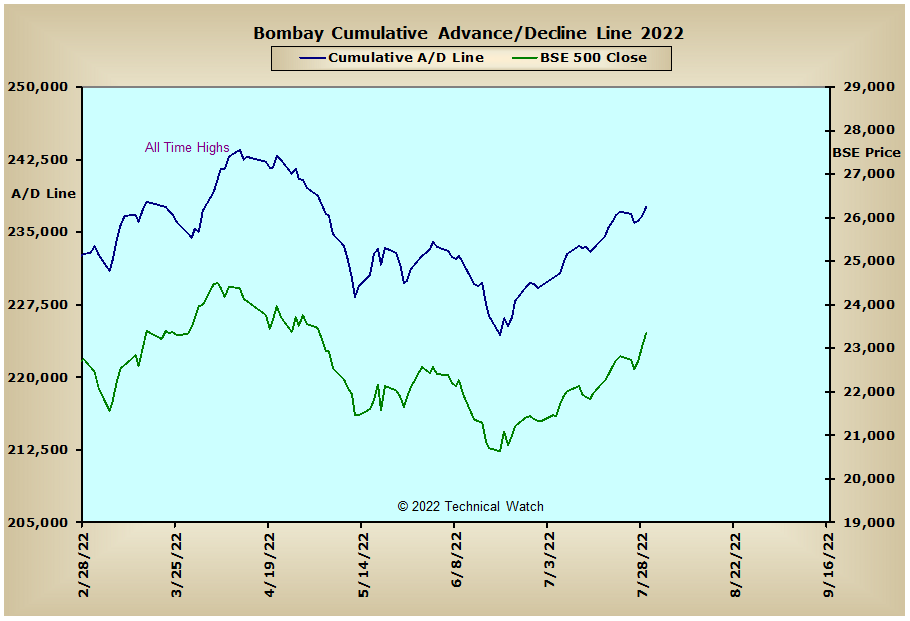
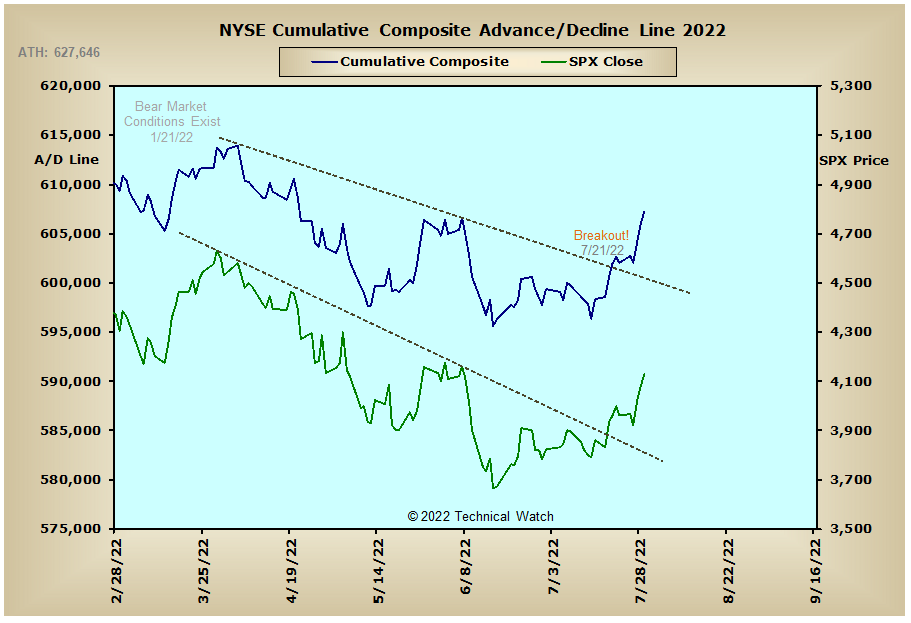
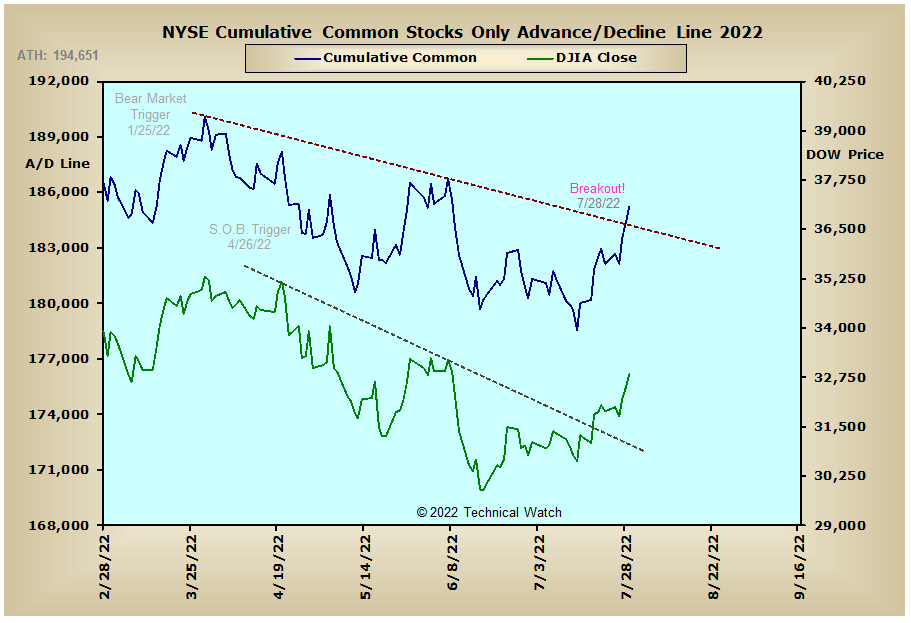
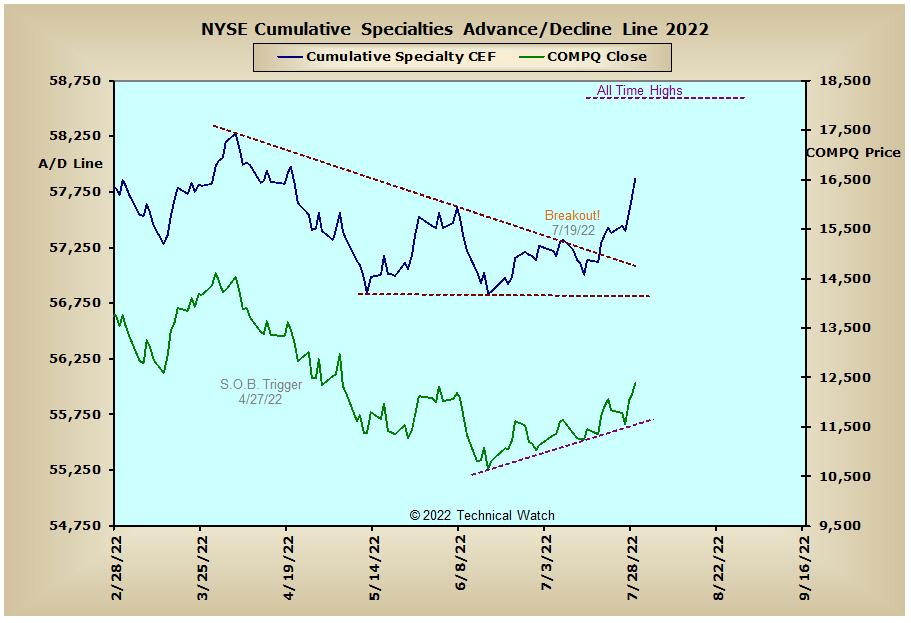
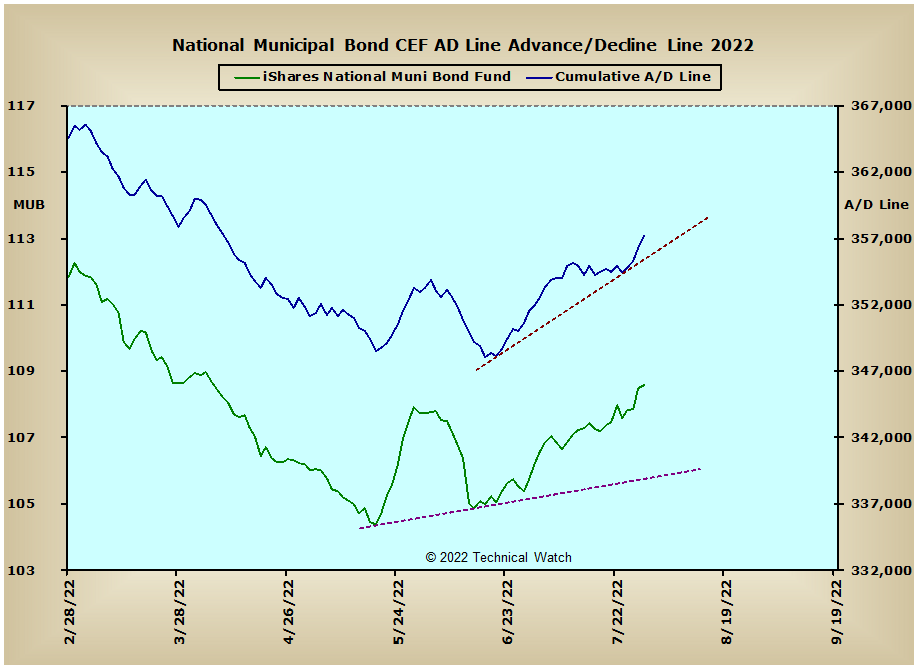
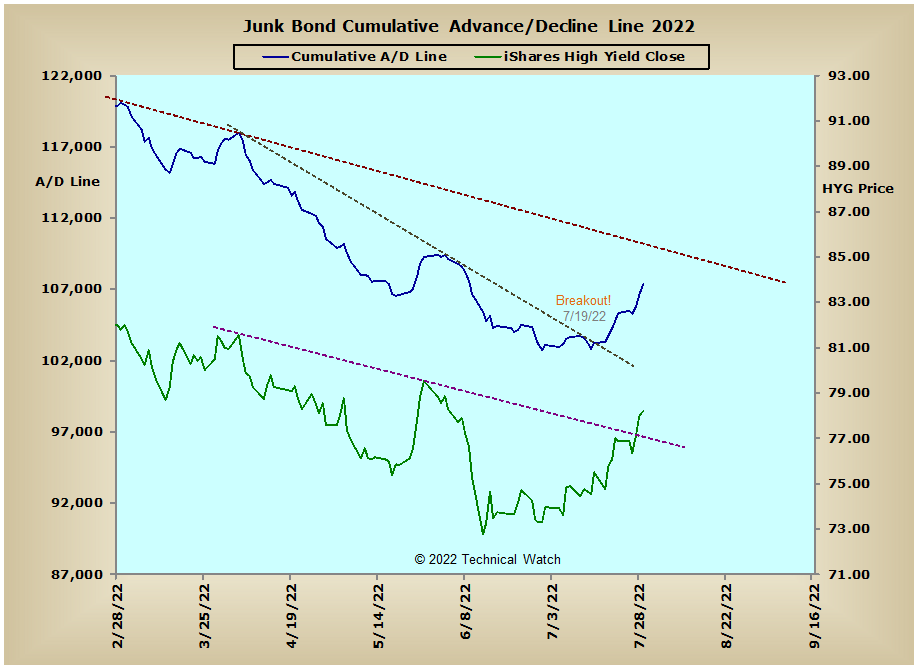
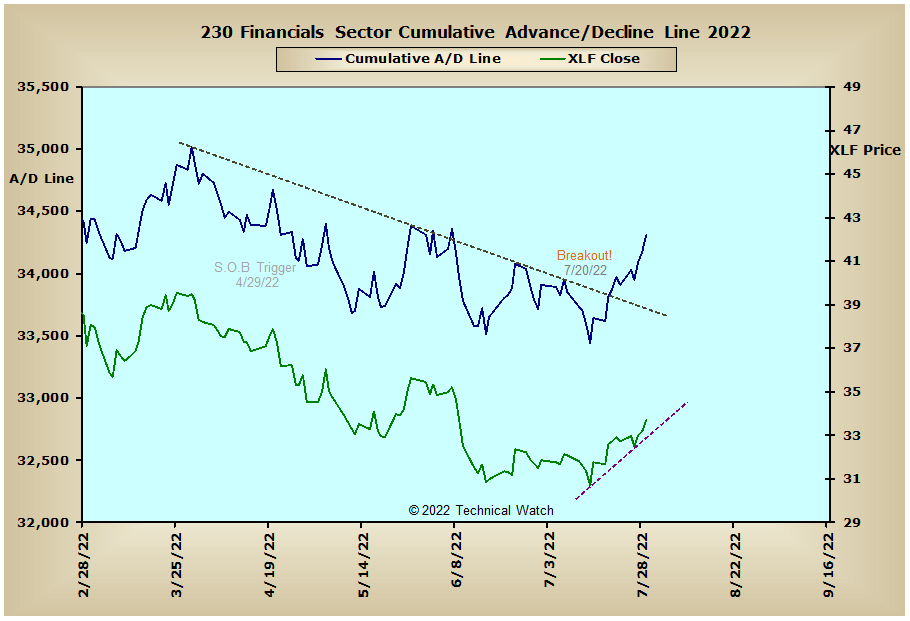
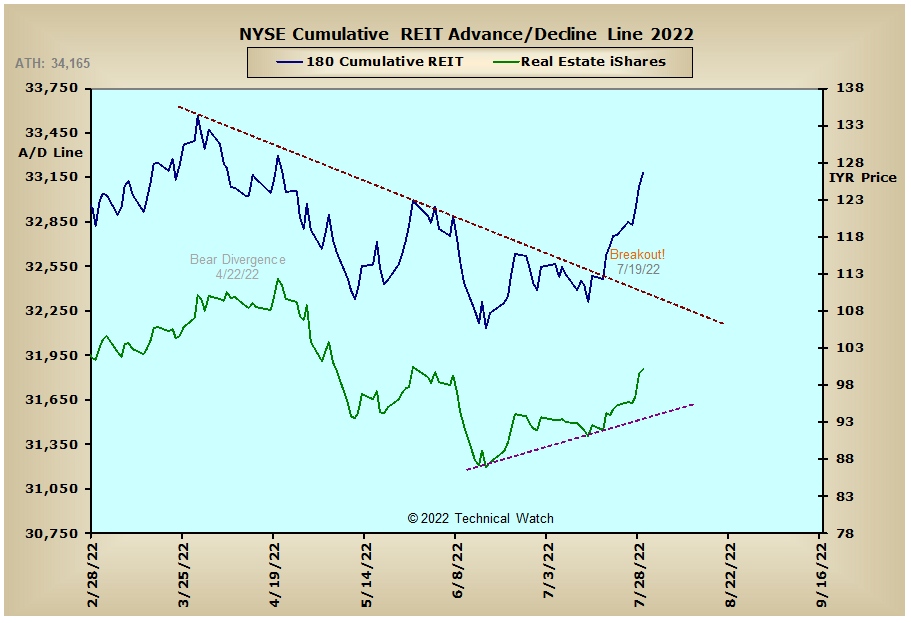
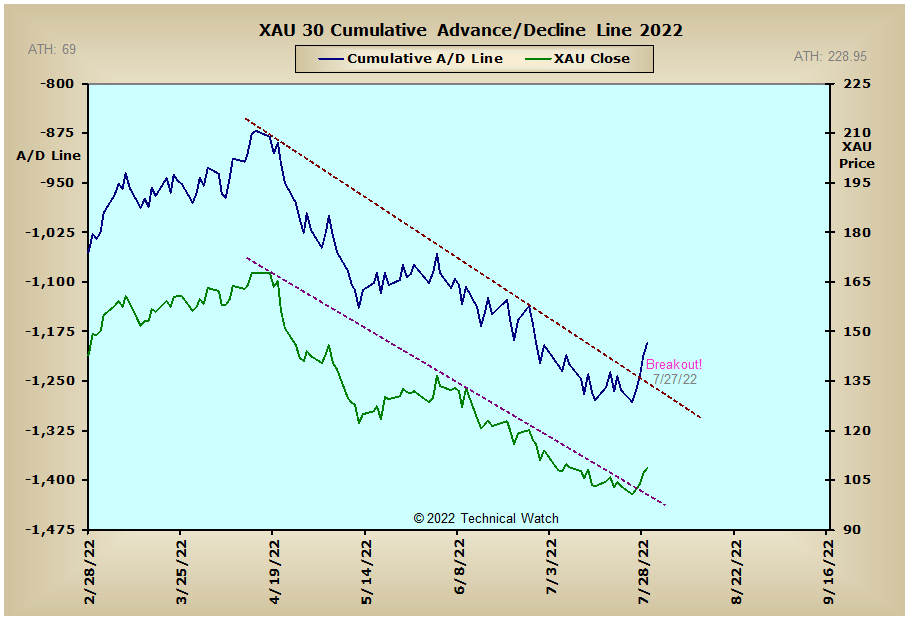
Looking over our standard array of cumulative breadth charts for this week shows another small set of trendline breakouts to the upside which included the NYSE Common Only, Precious Metals and XAU advance/decline lines. Also of note is that England's FTSE advance/decline line closed at new all time highs on Friday. Several other money flow lines, both domestically and internationally, are also not too far away from their own historic levels as investment capital continues to bet on a more neutral monetary policy from the Federal Reserve as soon as the September meeting.
So with the BETS moving higher to a reading of -20, the overall trading environment has now become more neutral. Looking at the daily chart action of the major market indices and we continue to see bearish EMA configurations as none have yet seen their 20 day EMA's cross back above their 50 day EMA's as prices continue their snapback rally to or toward their 200 day EMA's of longer term resistance. Looking at the short term trend of breadth as measured by the McClellan Oscillator, and all remain strong at this time. Meanwhile, this short term strength has now helped the breadth McClellan Summation Indexes to move back to or even above their respective zero lines over the past week. This now changes the outlook for the rest of August from that of a bearish bias to something more neutral in scope. Of course, with several A/D lines nearing their all time highs, this more neutral outlook could turn quite bullish as we move into the 4th quarter of this year especially if the MCO highs of late May are taken out. On the flip side, the volume MCO's are currently mixed as new reaction highs were seen last week in some, while others continue to diverge with the mid July price highs. This lack of a broader based synchronization between breadth and volume will need to remedied in order to break the back of the current bear market condition. If not, this absence of agreement would encourage the development of a larger trading range of economic stagflation as we go into 2023. For now, any open short positions should be strategically monitored and/or covered until we get more information, with investors now standing aside, and traders going back to "hit and run" trading strategies.
Have a great trading week!
US Interest Rates: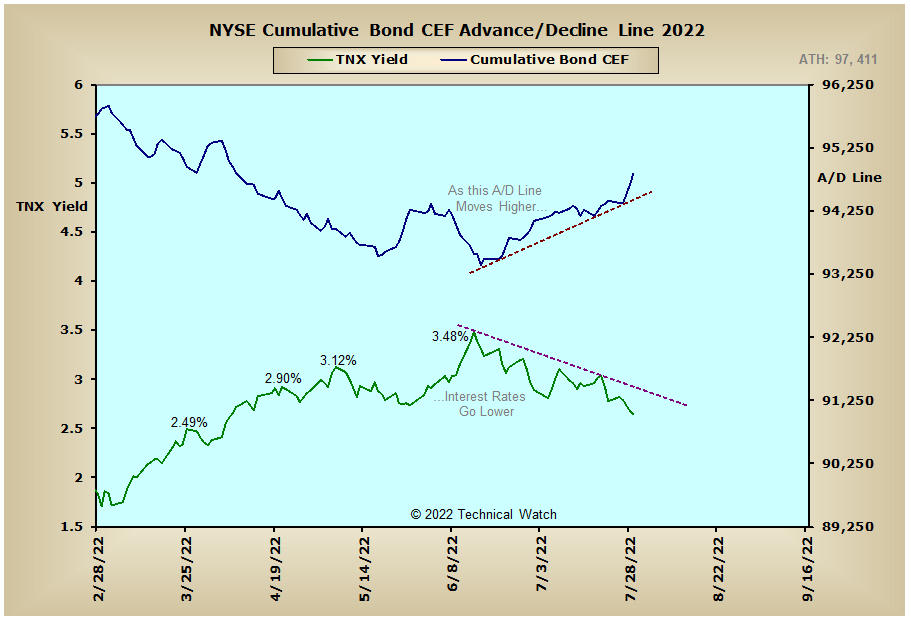
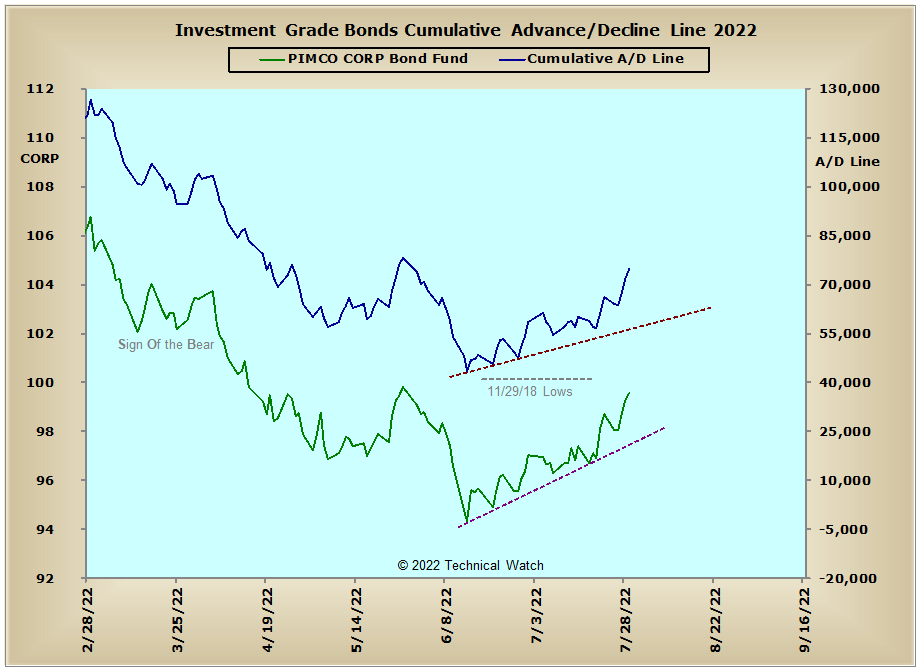
US Sectors: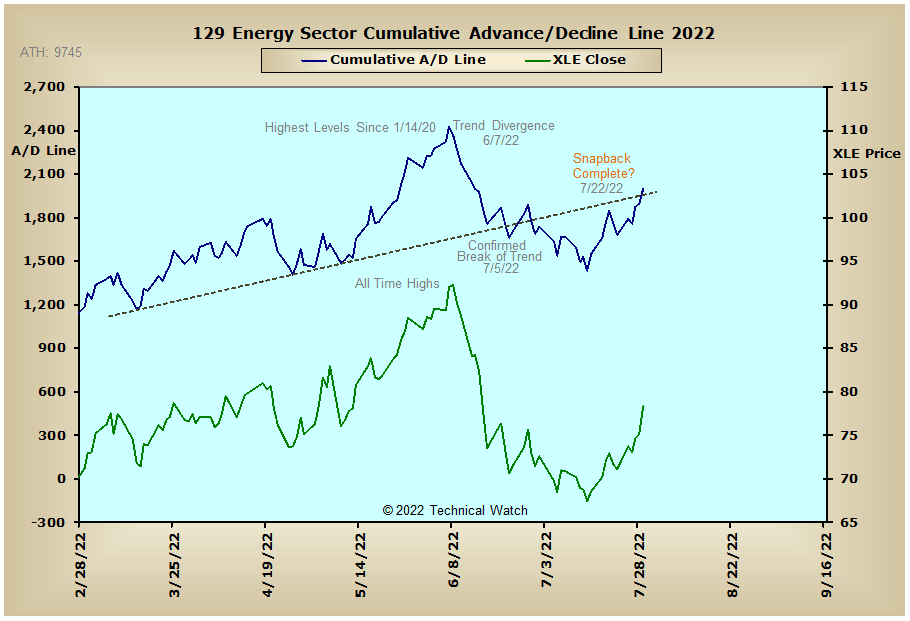
Precious Metals: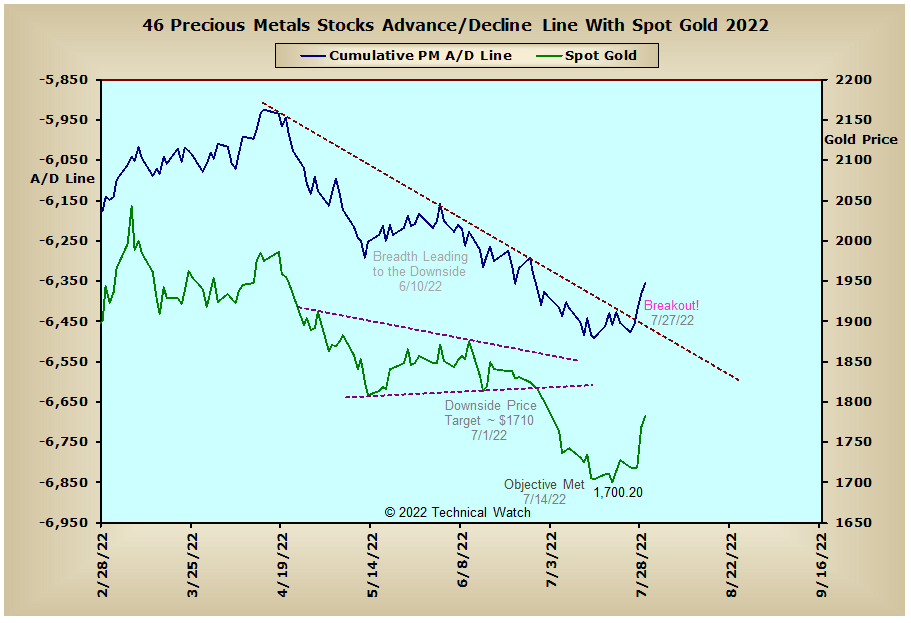
Australia: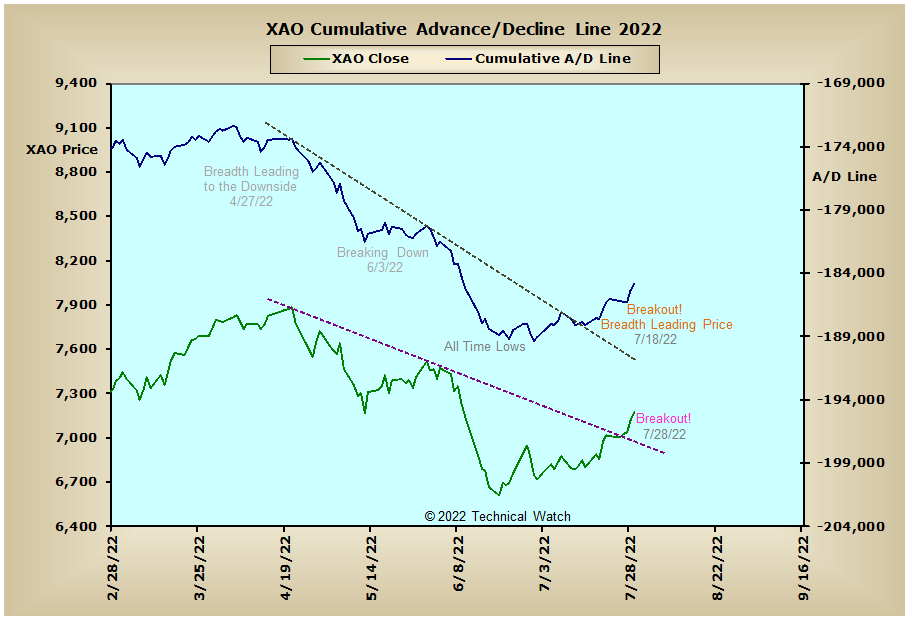
England: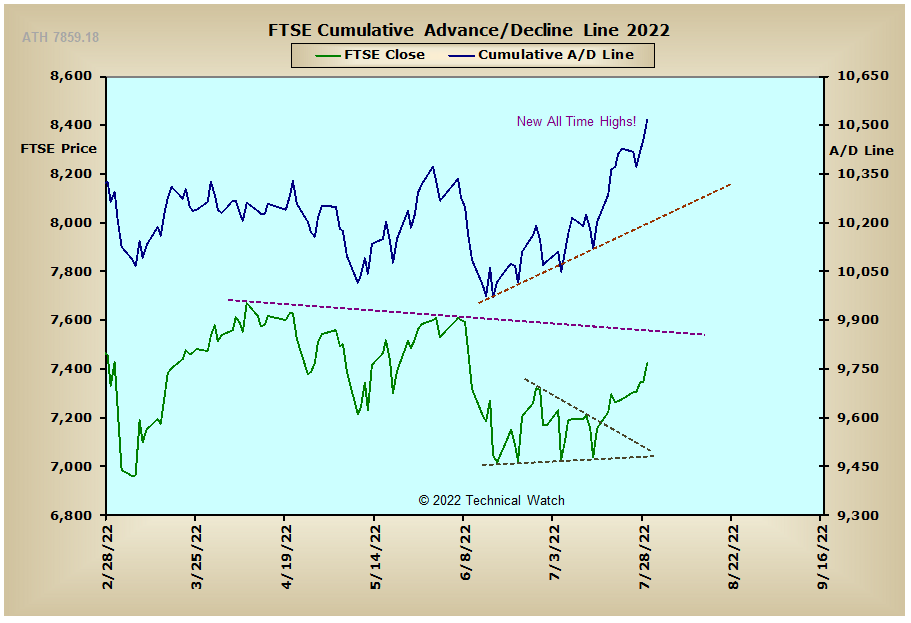
France: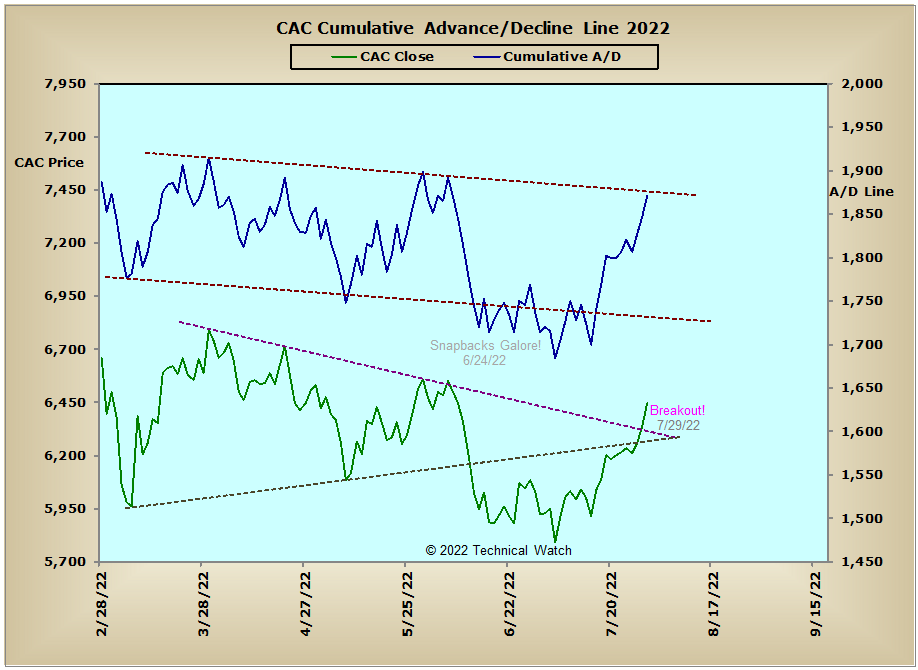
Germany:
India: