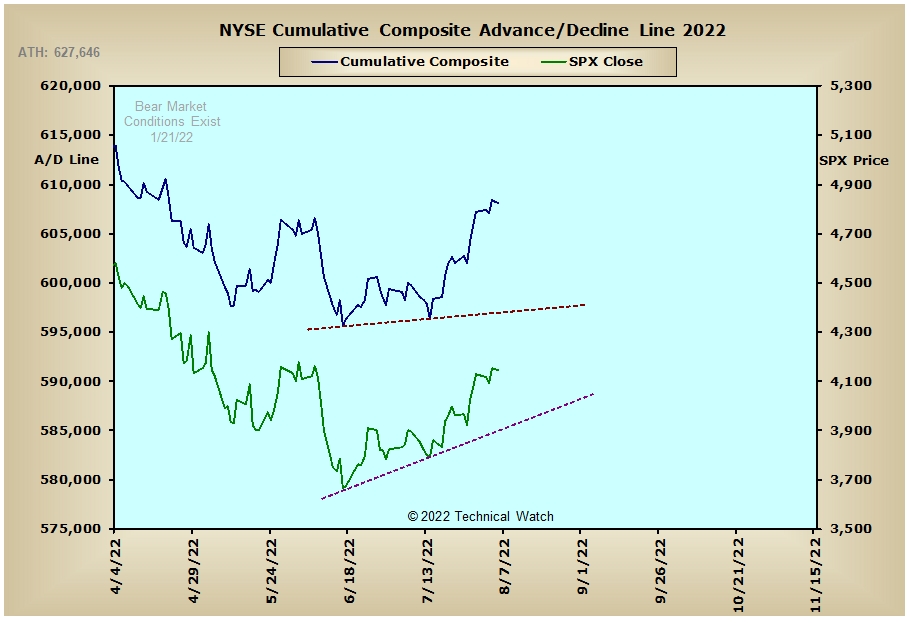
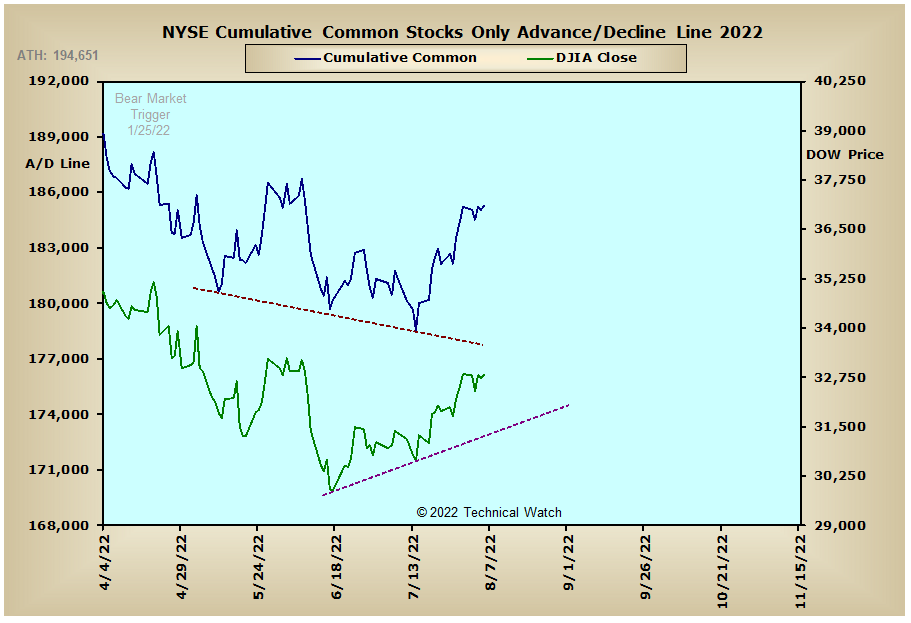
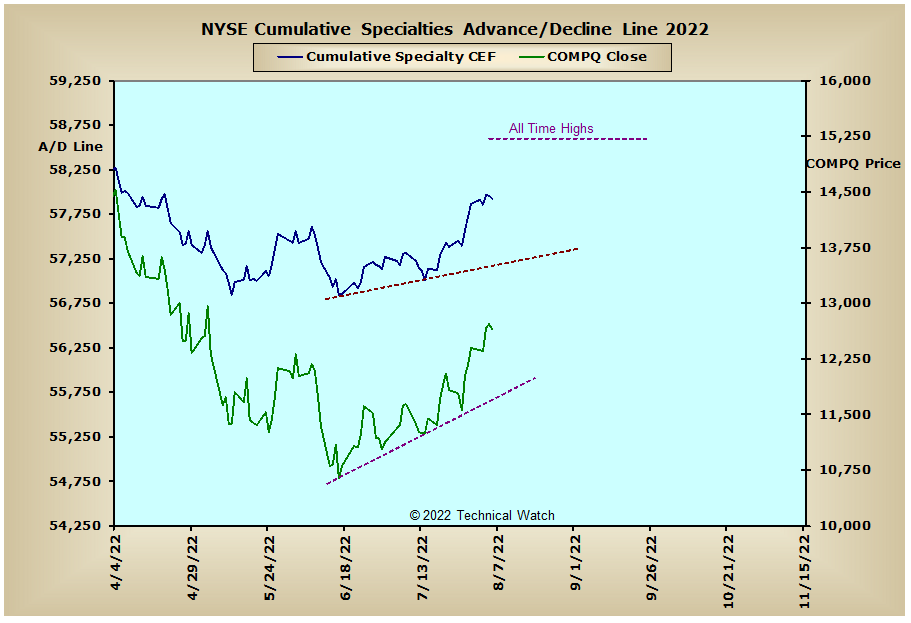
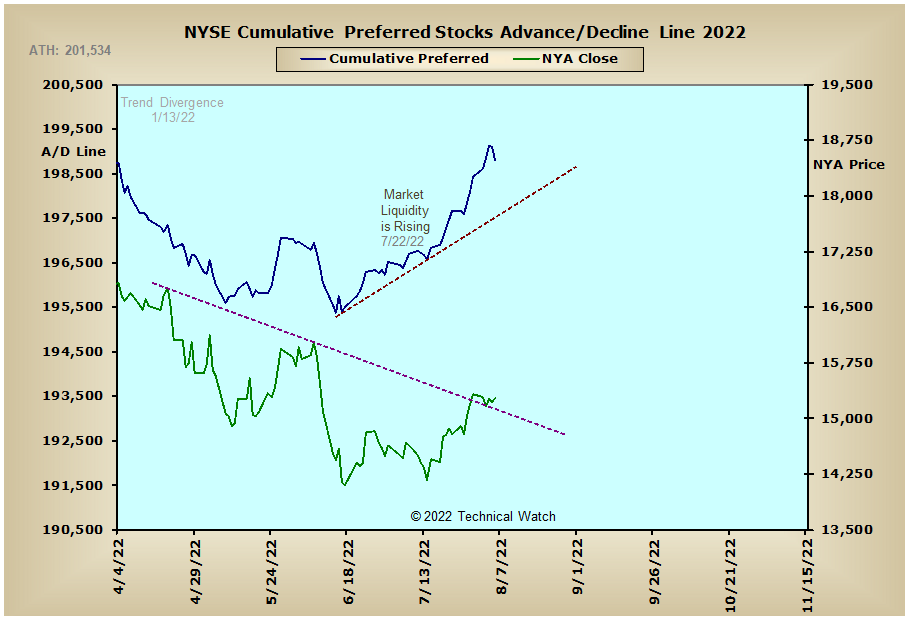
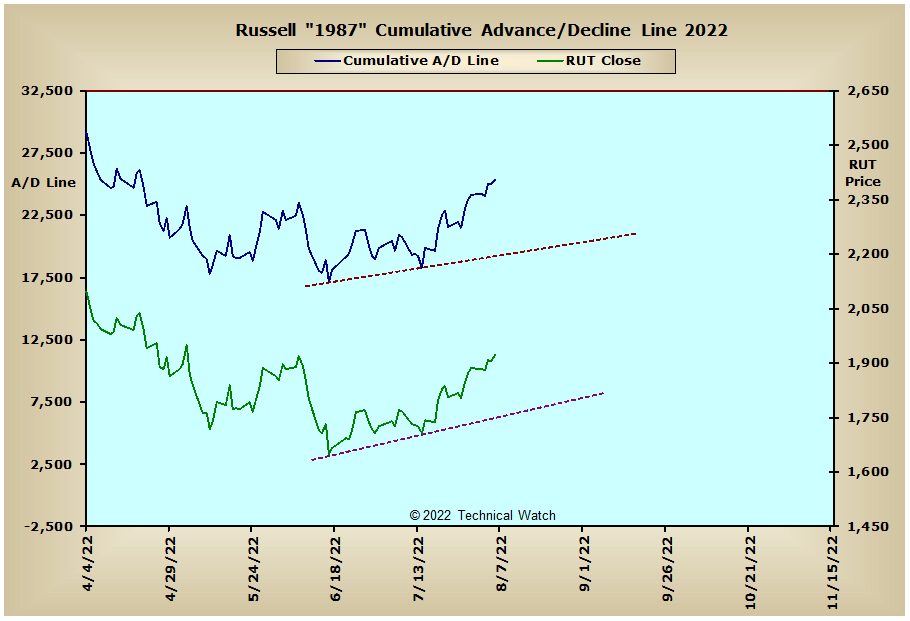
Please note that the time axis has been adjusted this week to provide better analytical insight moving forward.
It turned out to be a week of price digestion for the major market indices as they finished slightly higher by an average of +.27% with the NASDAQ Composite Index keeping things buoyant with a gain of +2.15%.
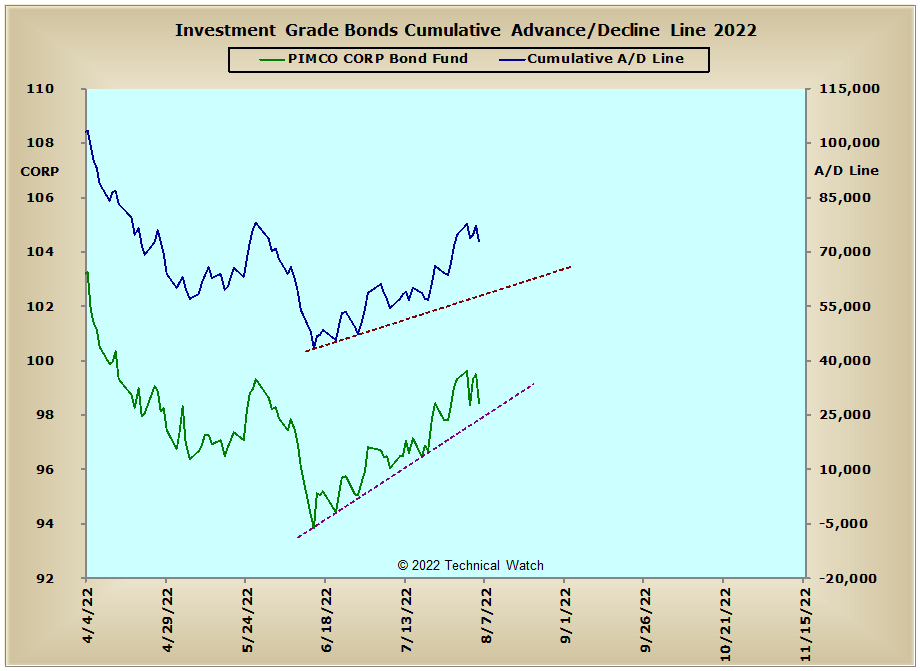
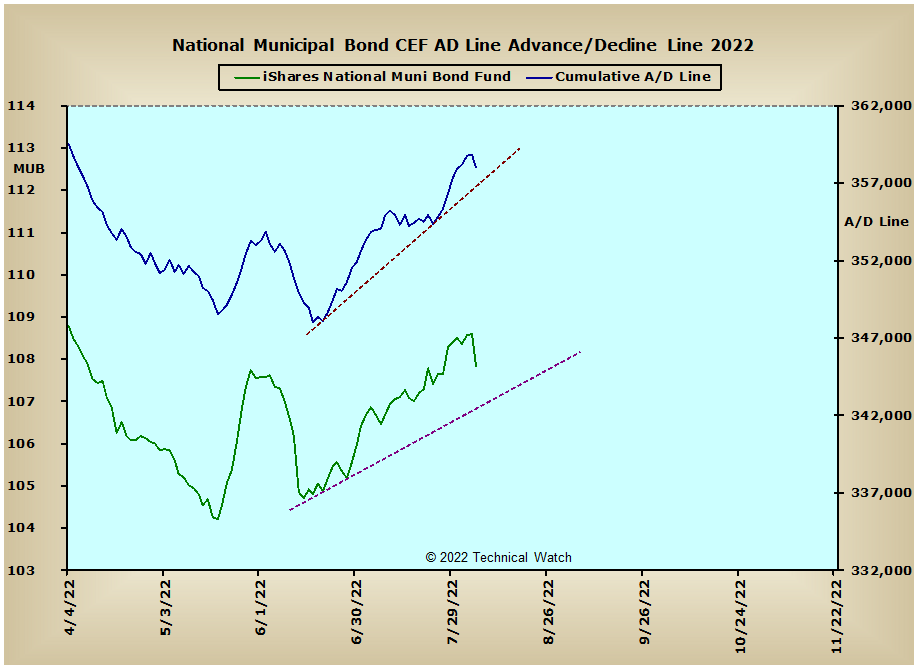
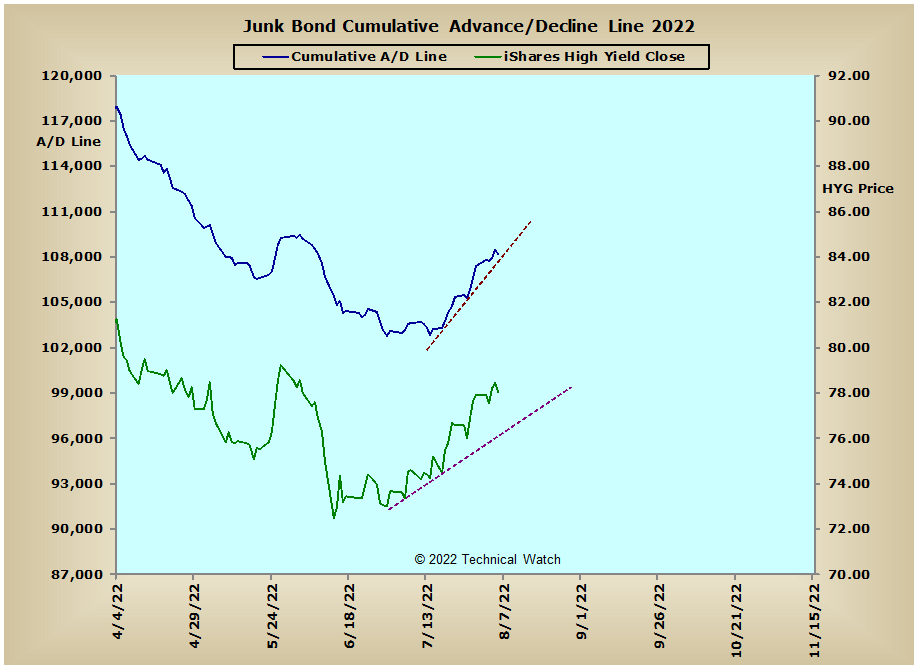
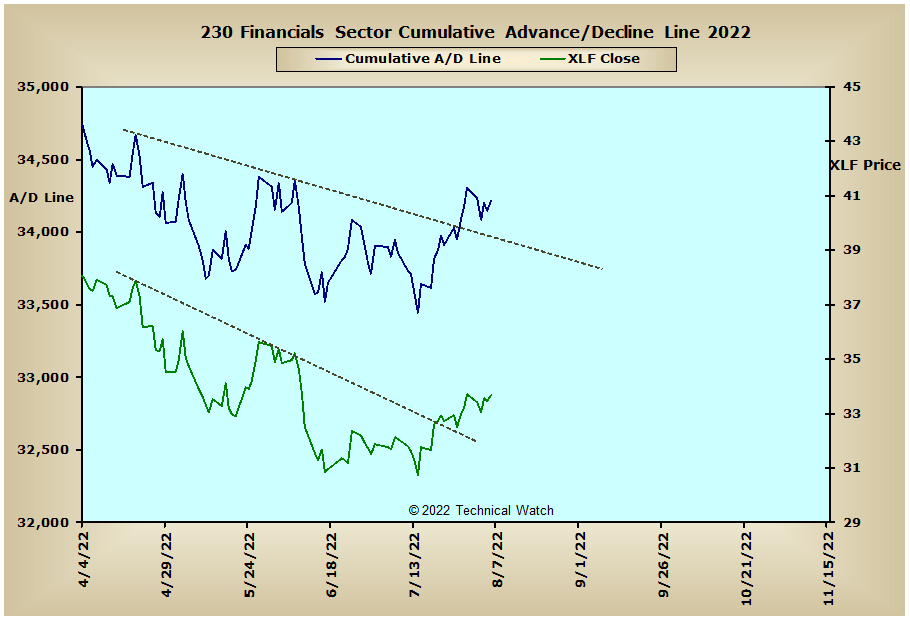
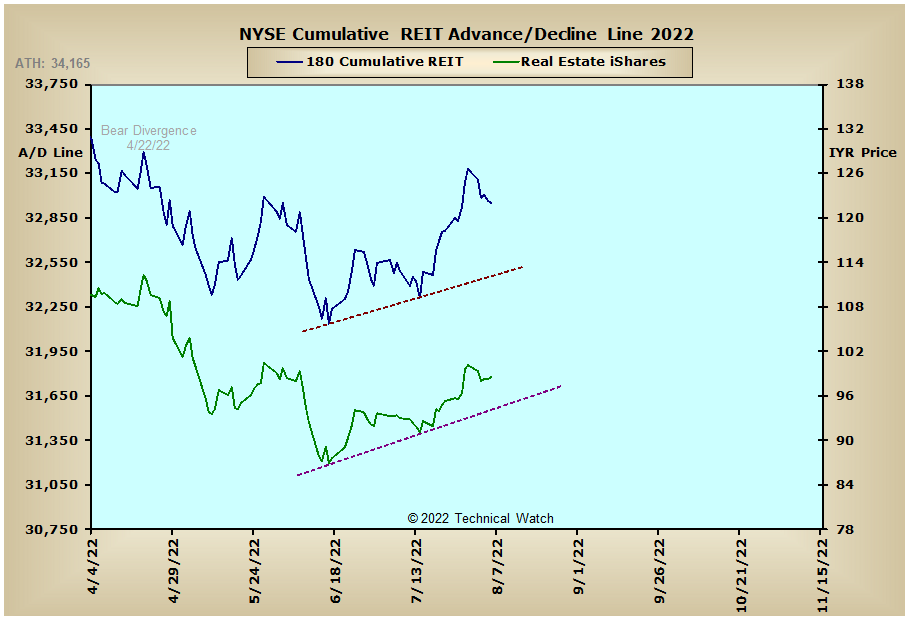
Looking over this week's edition of cumulative breadth charts shows very little in the way of analytical changes from the week before as all of the advance/decline lines continue to maintain their pattern sequences of rising bottoms. Biggest problem for the bulls continues to be the breadth to price divergence noted in the NYSE Common Only advance/decline line with the July 14th price lows. This internal non confirmation is keeping the recovery in the broader based New York Composite Index on the ambiguous side in relation to its upside progress with the other major market indexes. Taken together, this would then suggest that another round of market weakness is still likely to be seen before a more robust longer term internal platform is actually constructed. Both the Investment Grade and Junk Bond advance/decline lines are now challenging their late May highs with the Investment Grade group providing bearish divergence with the recent highs seen on August 1st. It will be important for the equity bulls for the interest rate sensitive issues to show a bit more amplitude in their cumulative structures for the current bear market condition to be completely extinguished. Until such time is noted, we have no choice but to continue to trade under bear market rules which includes the occasional relief rally every so often just to keep things interesting.
So with the BETS showing a reading on Friday of -25, traders and investors are back to being defensive toward equities after being neutral just the week before. All of the breadth McClellan Oscillators remain with a short term pattern of bottoms above bottoms at this time, although, both the NASDAQ and NDX breadth MCO's continue to show bearish divergences with their current price recoveries as they near their 200 day EMA's. Developing weakness is also noted in several volume MCO's at this time which, once again, includes divergences in both the NASDAQ and NDX basket of issues. It should also be noted that the Dow volume MCO moved to a sell signal on Friday which will likely be a weight on the large caps for the week ahead. Friday's NYSE TRIN number showed a high degree of short covering with a reading of .54...the lowest such reading since the breakout lows of June 19th. This has now relieved much of the imbalance on the sell side in the NYSE Open 10 which finished on Friday with a minimally "oversold" reading of 1.08. The latest 10 day average of put/call ratios continues to be somewhat indecisive, though trader bias remains with the expectation of further price gains and the buying of calls. Put option volatility readings are now matching those of the late March price highs, while last week's Wall Street Sentiment readings continue to show a bullish outlook by a 2 to 1 margin. With all of the major market indexes approaching their 200 day EMA's, we will likely see a challenge of this longer term trendline sometime next week to complete our upside expectations from the June lows. Additionally, with August OPEX coming up on the 19th, it wouldn't be too surprising to see prices continue to trade in and around current levels for much of the week ahead as all of the MCO's are likely to begin their "engine shutdown" sequences and move back into negative territory. With all this as a backdrop then, investors should go ahead and remain on the guarded side while we wait for a more definitive path to walk on, while traders and scalpers continue with their daily hit and run trading strategies.
Have a great trading week!
US Interest Rates: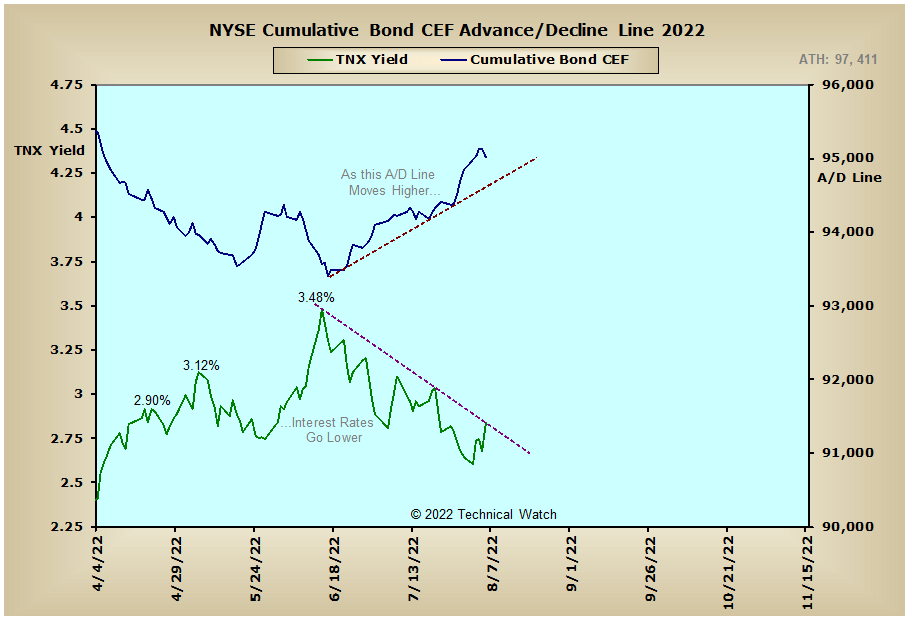
US Sectors:
Precious Metals:
Australia:
England:
France:
Germany: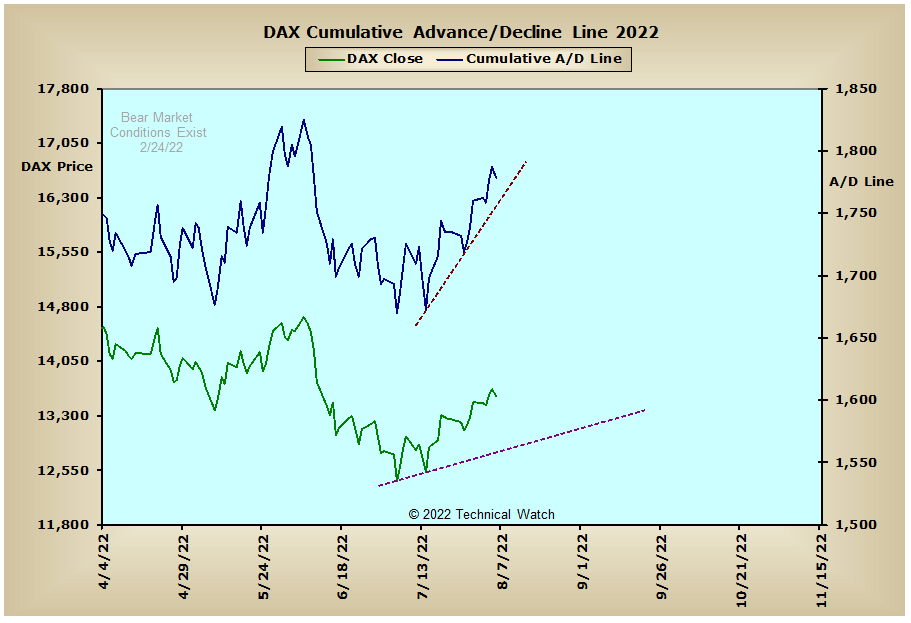
India: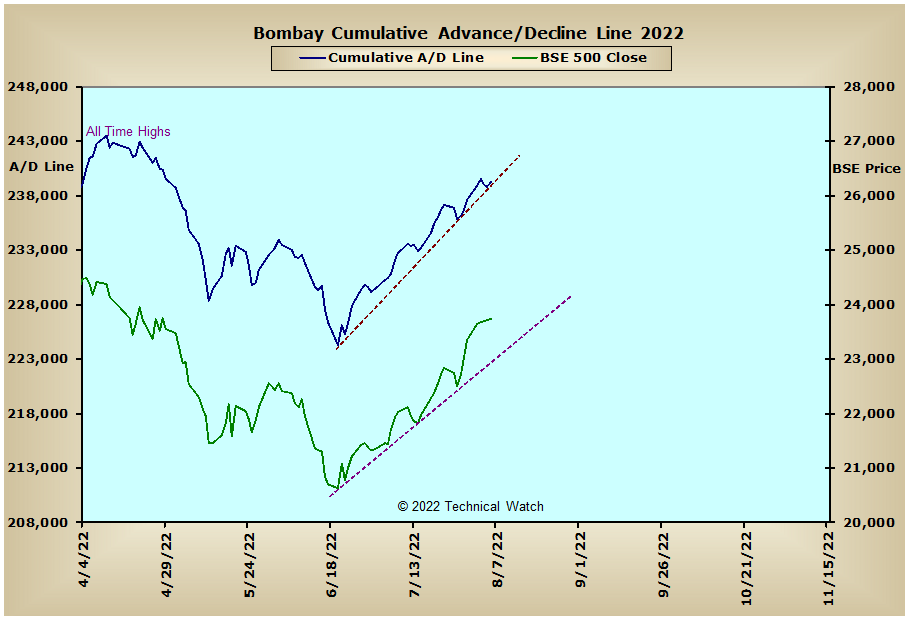
Edited by fib_1618, 12 August 2022 - 12:24 AM.


