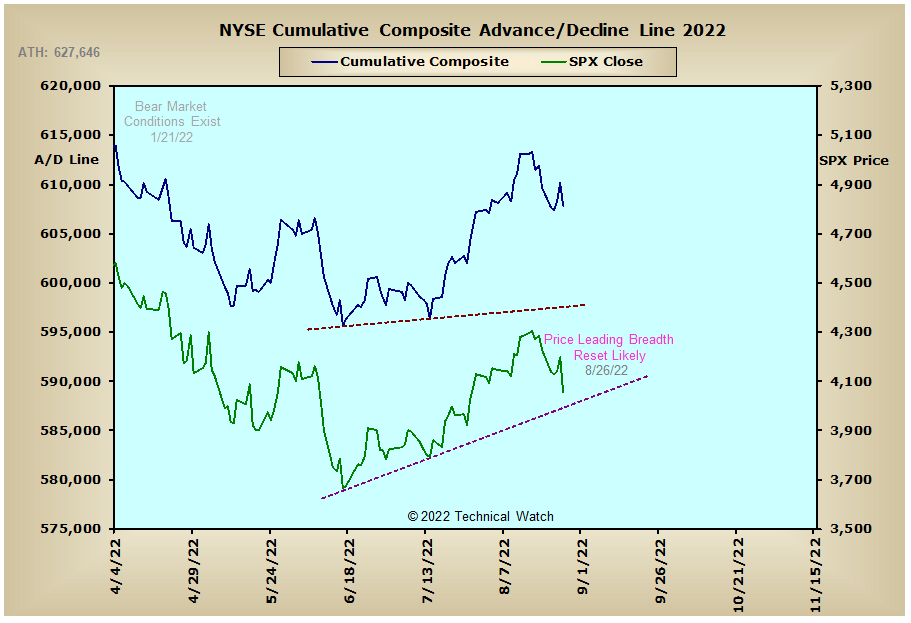
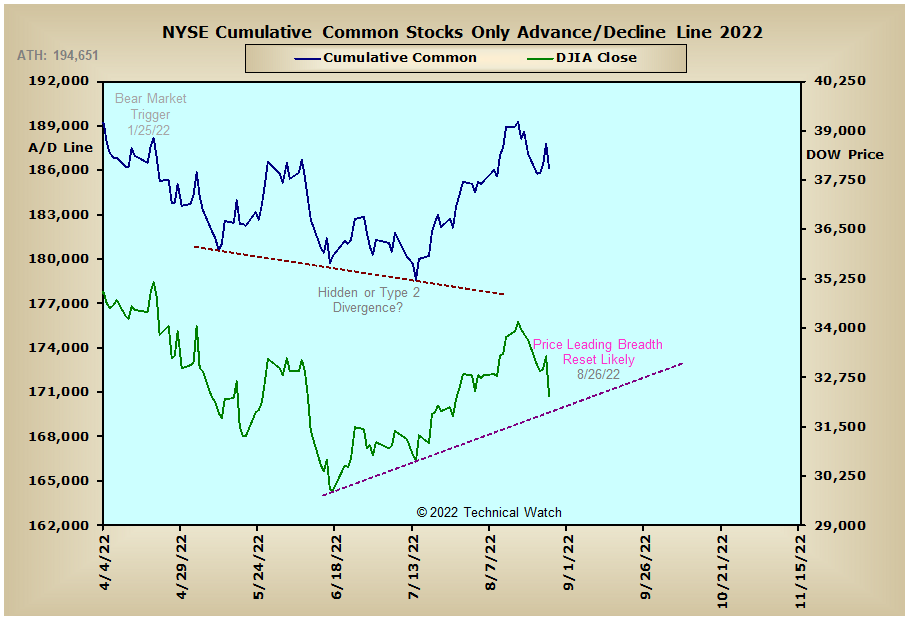
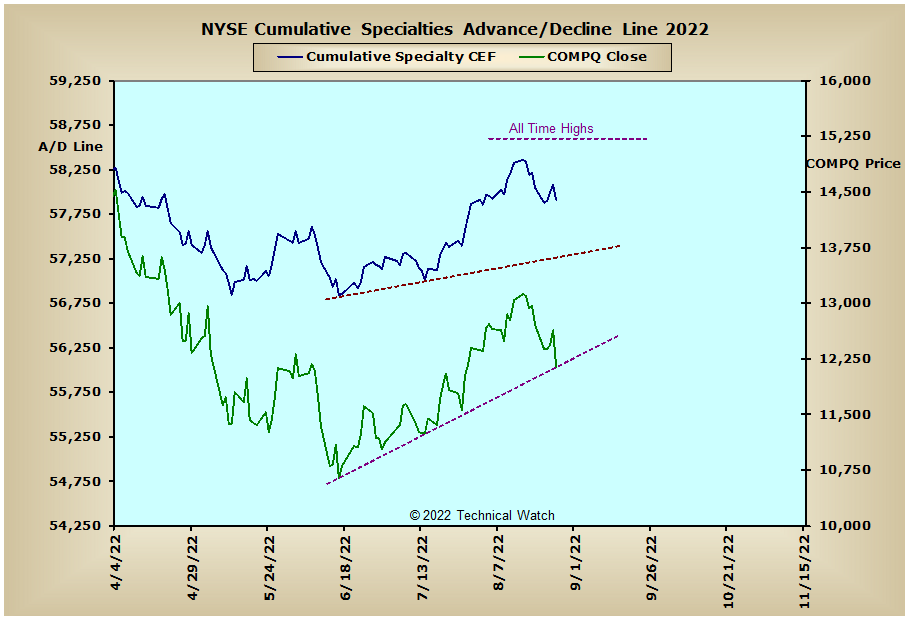
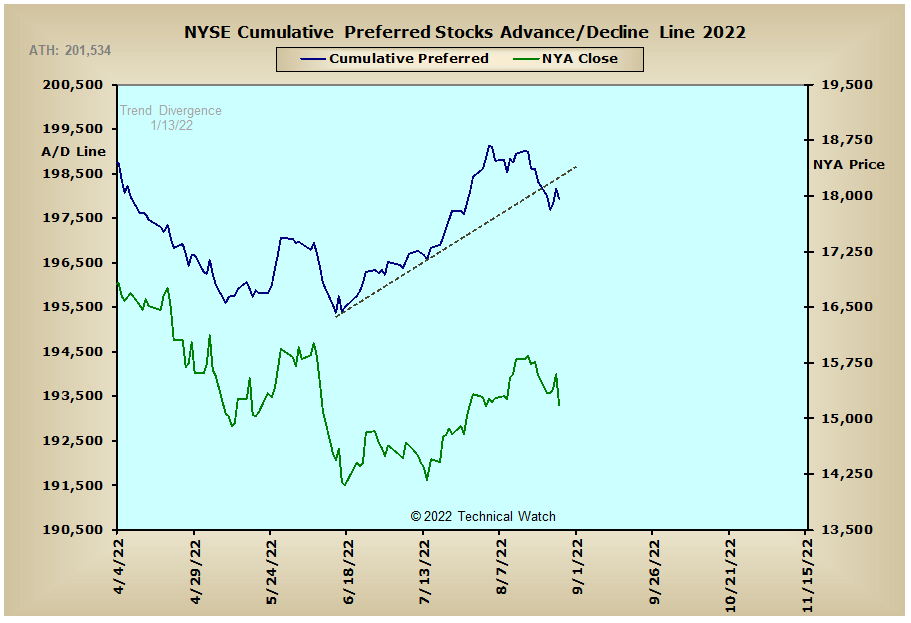
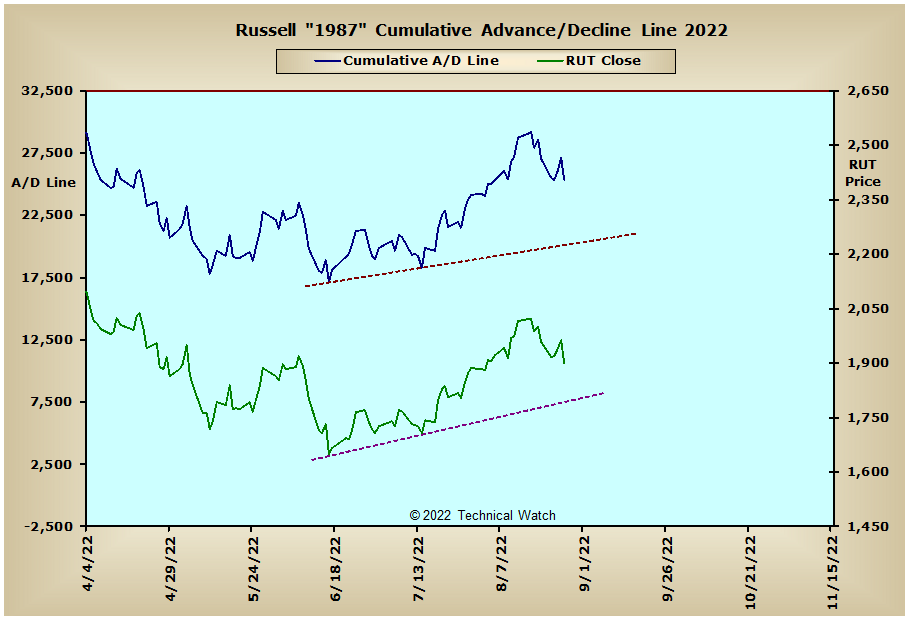
It was a tough week for the buyers as a one-two punch of both technical "overbought" conditions and fundamental reminders pushed the major market indexes lower by an average of -3.62%. Setting the pace to the downside was the NASDAQ Composite Index which gave back another -4.44%, while the New York Composite Index provided overall balance as it finished with a loss of -2.63%.
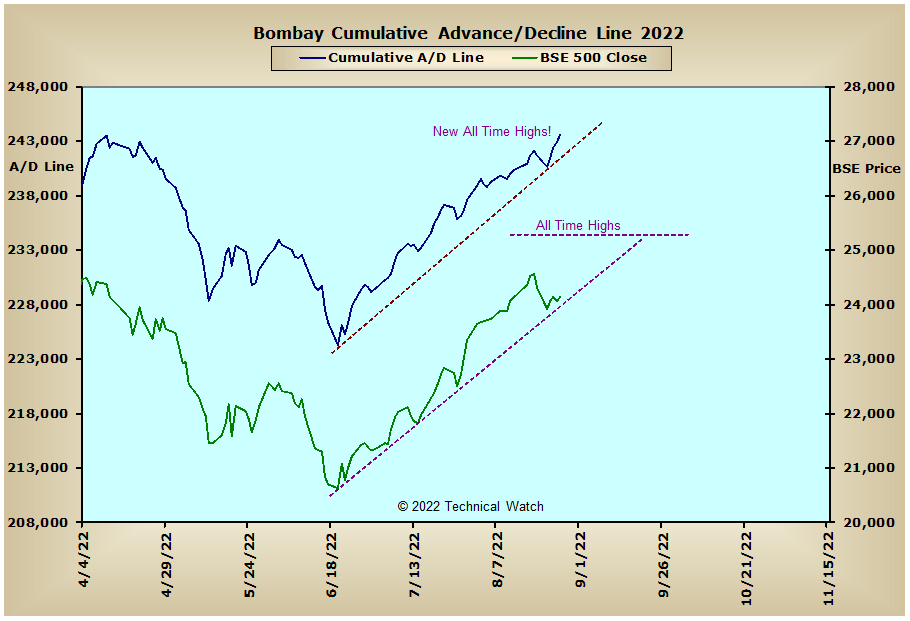
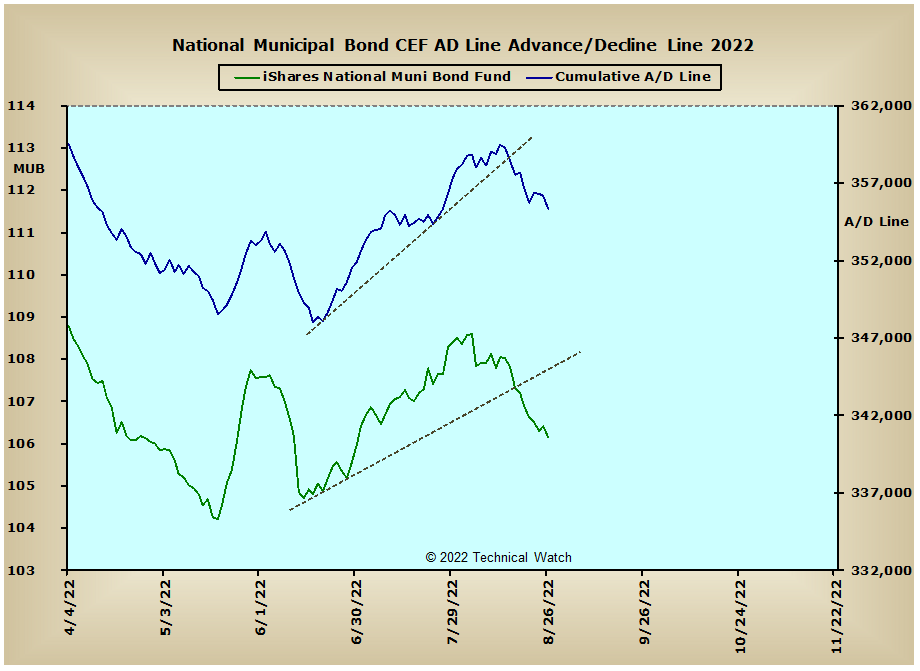
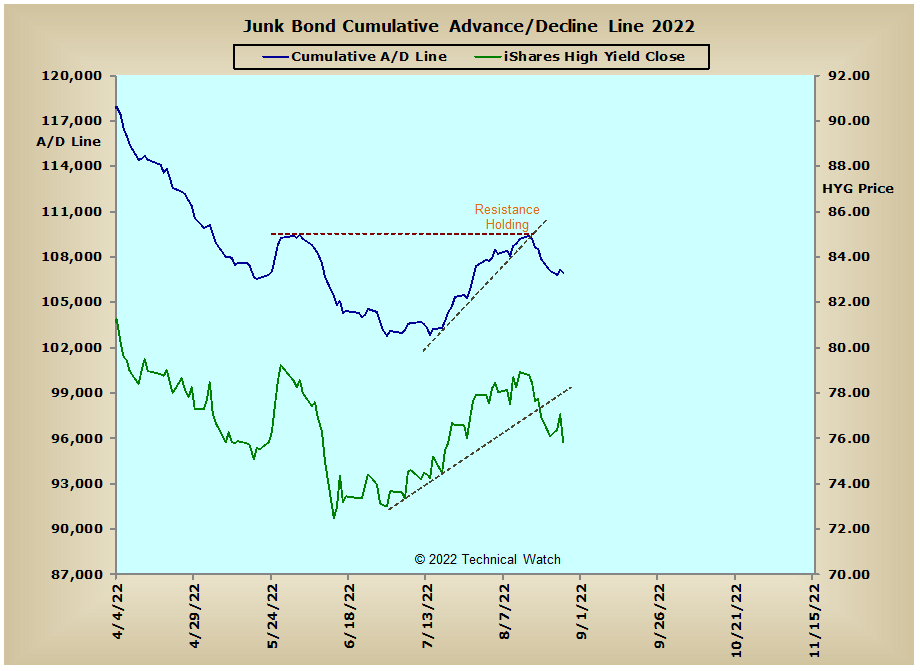
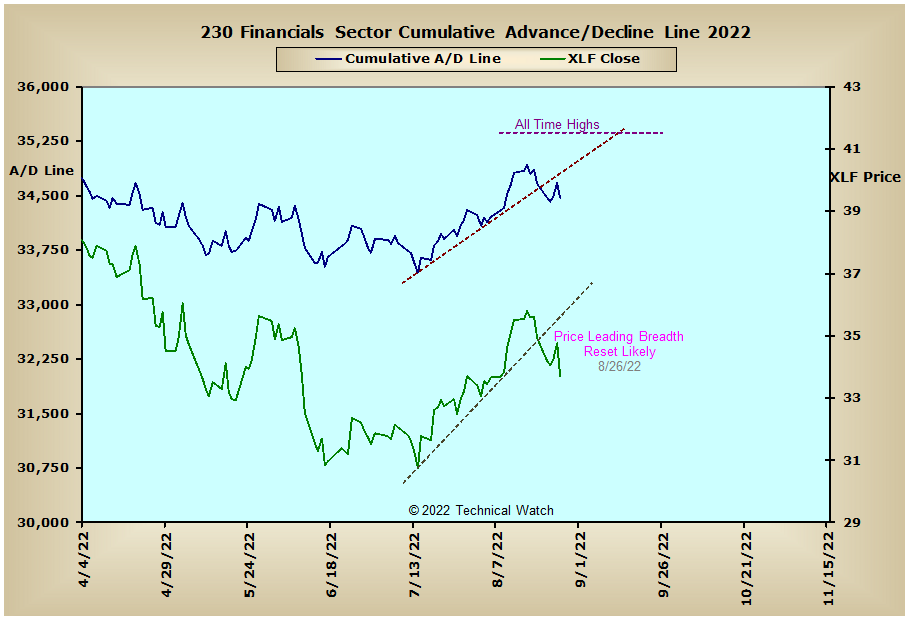
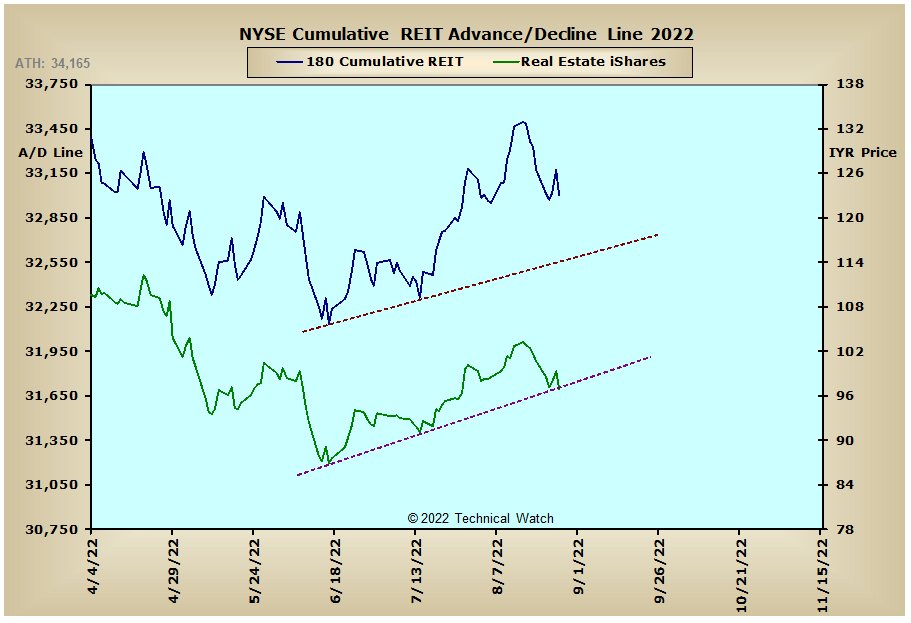
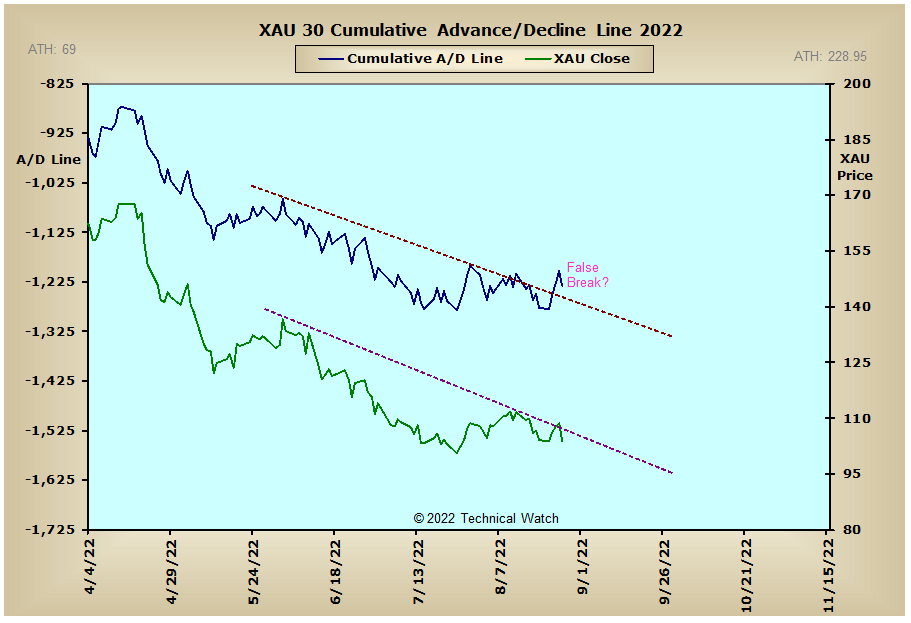
Taking a cursory look at this past week's cumulative breadth charts shows that many of the money flow lines are not leading prices lower at this time as Friday's sharp price declines came only as a reminder that further interest rate increases remain on the table as we go into the 4th quarter of 2022. Speaking of which, the NYSE Bond CEF's, Investment Grade Bond, Junk Bond and Municipal Bond advance/decline lines were the weakest area of investment last week as the latest FED Watch Tool is now back to showing a 67% chance of another 3/4% hike in rates at the forthcoming FED meeting on September 21st. European issues also got hit this past week with this same 1-2 punch, though on a positive note in the emerging markets camp, the Bombay advance/decline line was able to finish out the week at new all time highs.
So with the BETS a bit higher on Friday with a reading of -30, traders and investors remain with a defensive posture toward the equity markets. Looking at the breadth and volume McClellan Oscillators and we see that after smashing down and through their respective zero lines of support on Monday, and then providing obligatory technical snapbacks to or toward these same lines of short term balance between buyers and sellers into Thursday, the price declines of Friday finished with near term bullish MCO divergences as we begin the week ahead. This would suggest that after any follow through selling that might take place to begin the week, we should then see an attempt for prices to snap back to or even above either their respective 20 day, 50 day or 200 day EMA's before we get our first ADP numbers in 2 months on Wednesday, and then the jobs report by the labor department on Friday. With next weekend also a 3 day holiday weekend here in the United States, the week ahead should continue to be quite volatile overall as low August volume continues to accentuate price movement within the confines of a developing correctional sequence, with mid September still slated for the final price highs. With all this as a background then, investors should continue to stand aside for the time being while keeping a watchful eye on sector rotation, with traders and scalpers remaining with their highly successful "hit and run" trading strategies.
Have a great trading week!
US Interest Rates: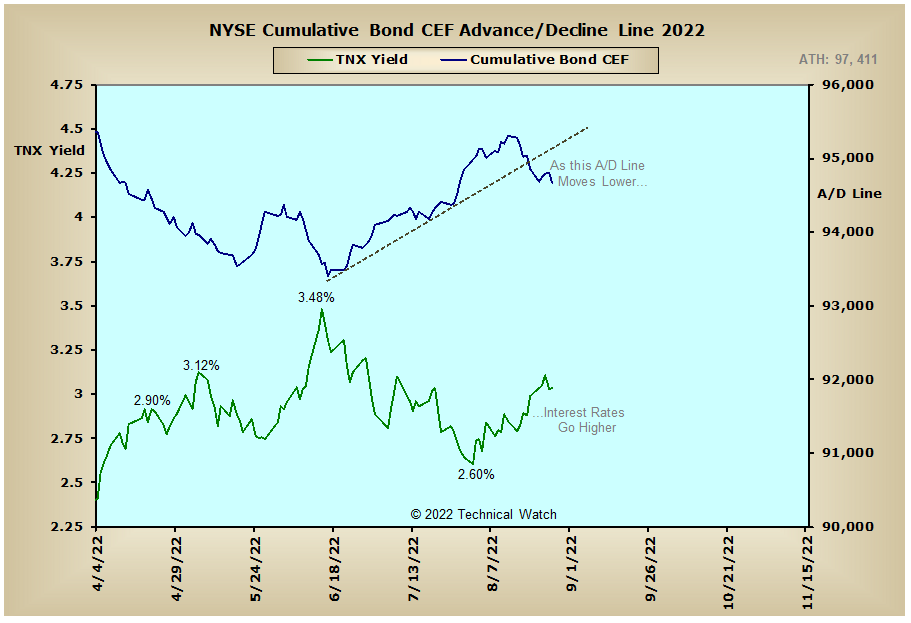
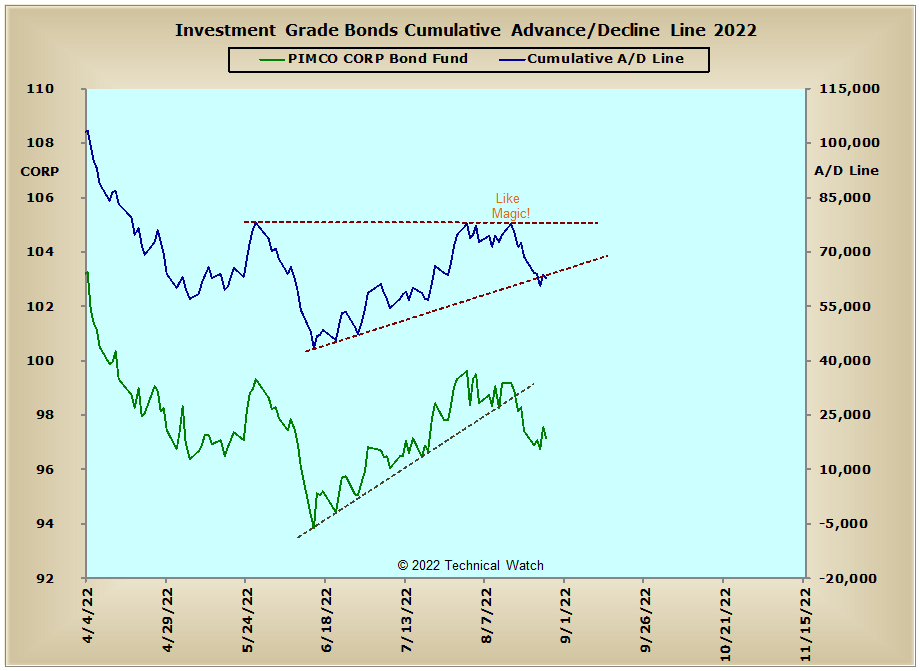
US Sectors: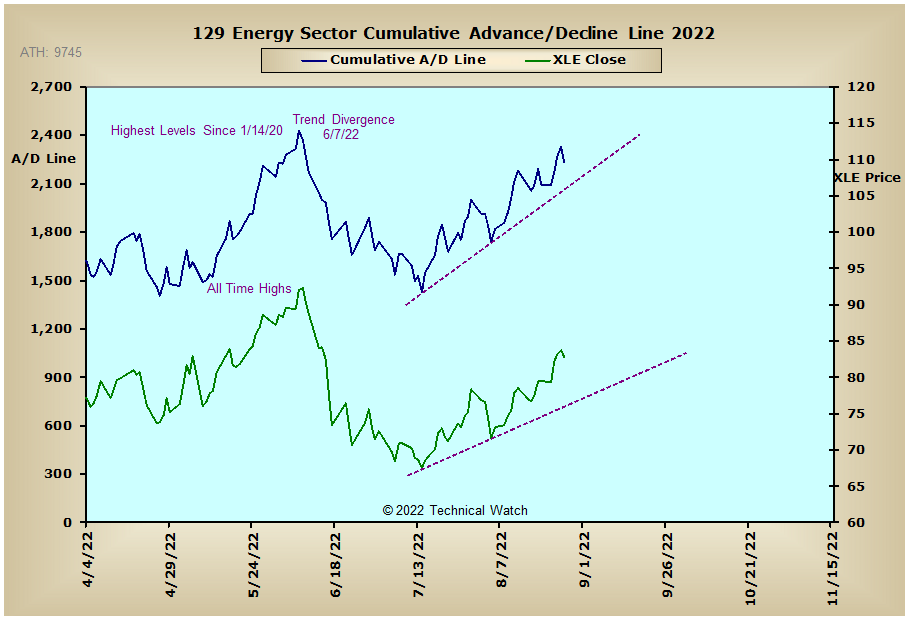
Precious Metals:
Australia: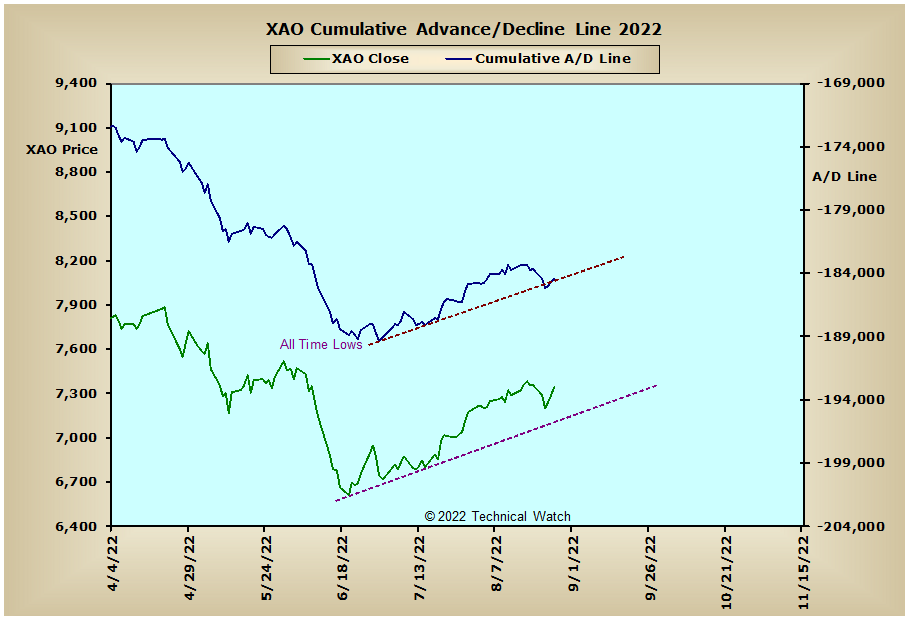
England: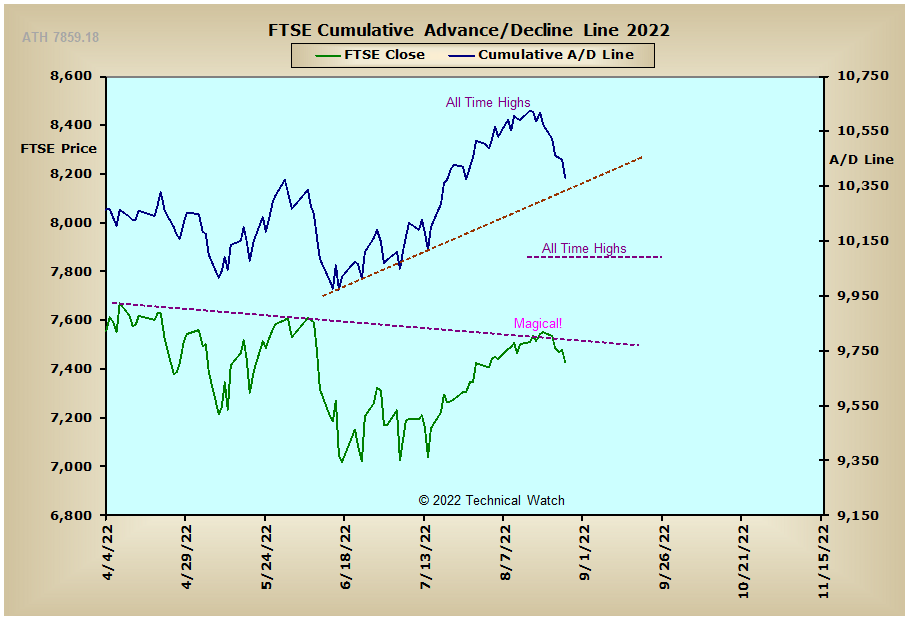
France: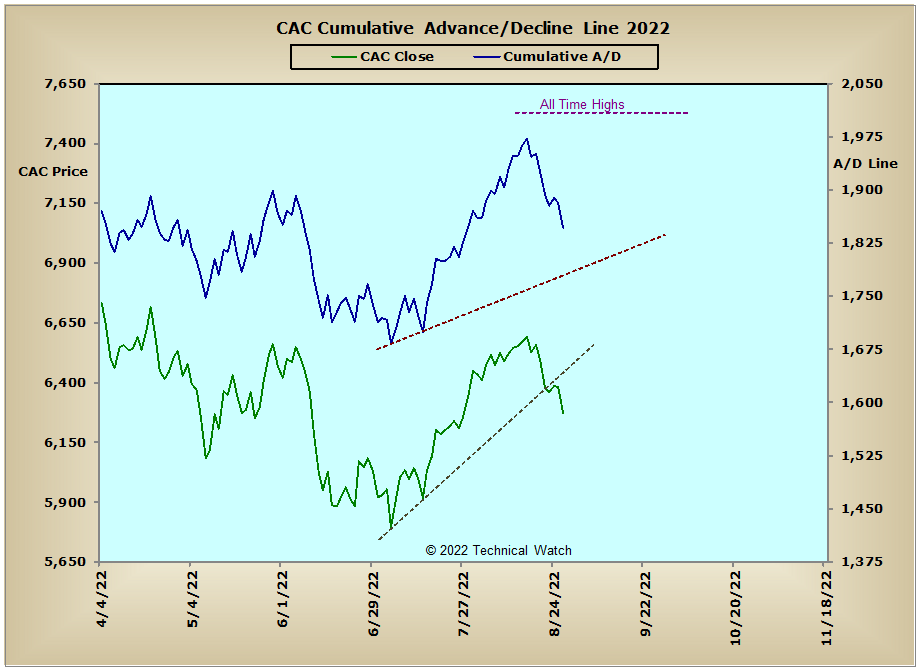
Germany: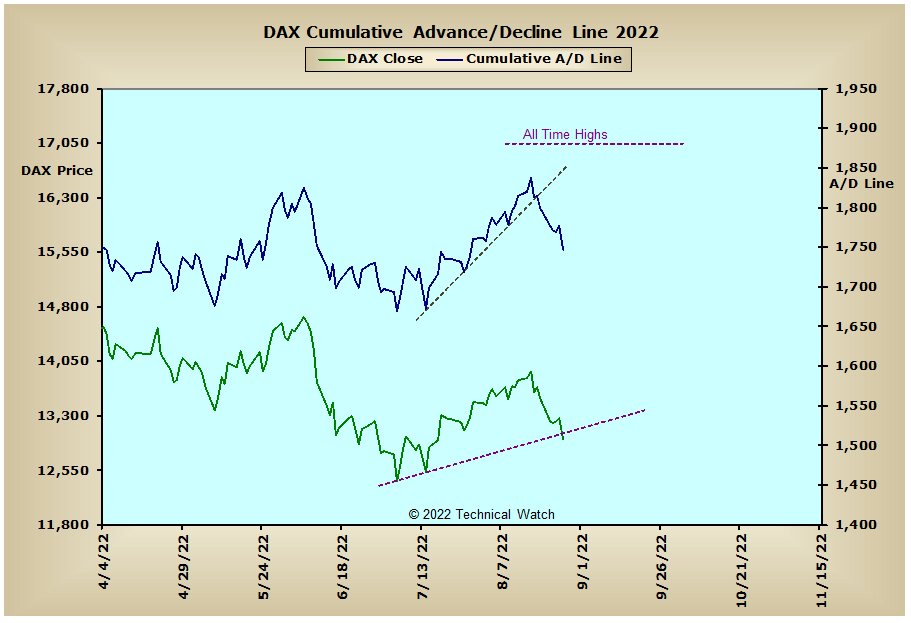
India: