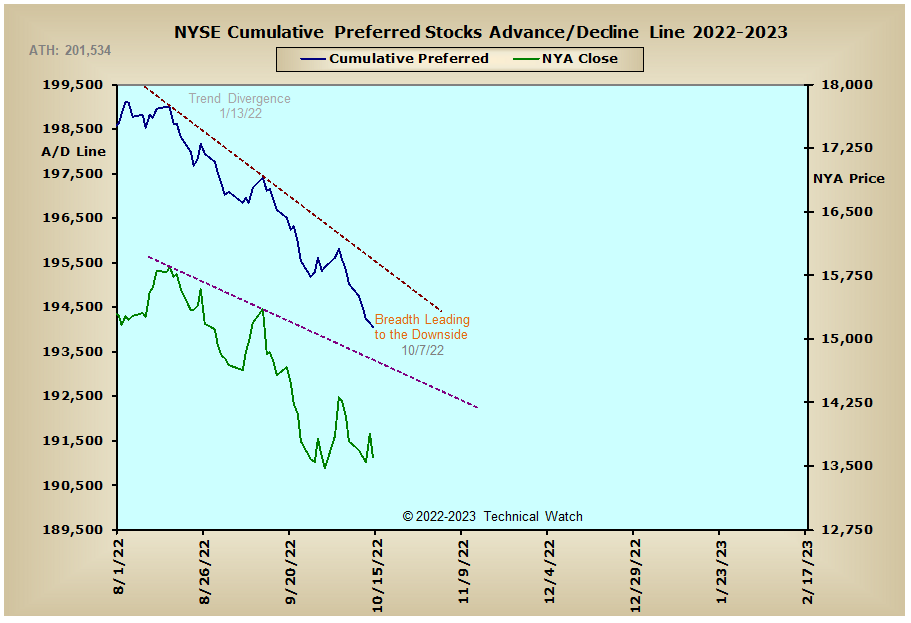
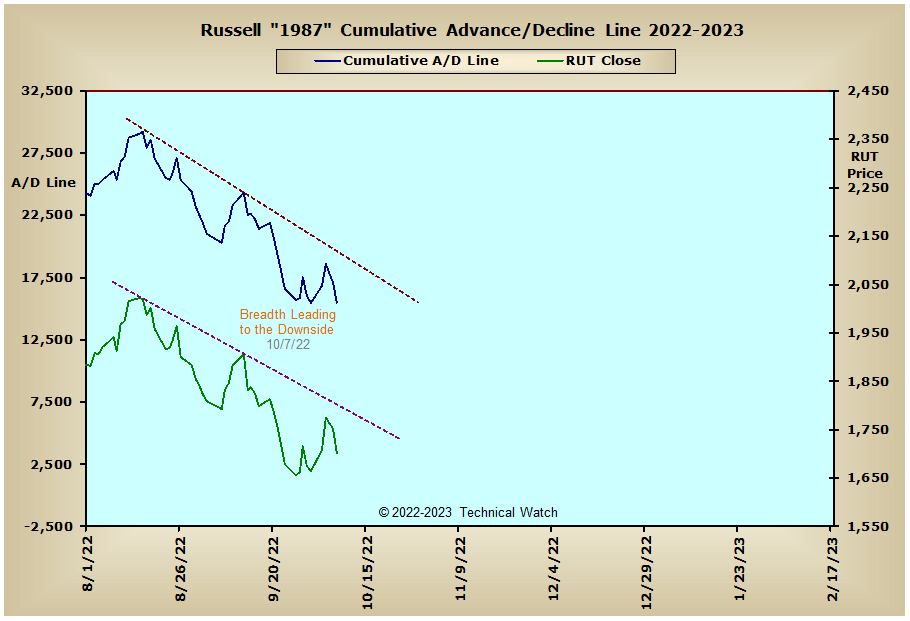
Please note that the time axis has been adjusted this week to provide better analytical value as we move forward.
It turned out to be a nervous week of stock market behavior as contained volatility early on turned into something more substantial after the release of the Consumer Price Index data on Thursday where the Dow Industrials saw a 1507 point swing from intraday low to intraday high. But with the 20 day and 200 week EMA's still providing strong resistance, the markets then closed sharply lower on Friday to finish with another average weekly loss of -1.02% as the Dow Industrials provided the only index gain of +1.15%.
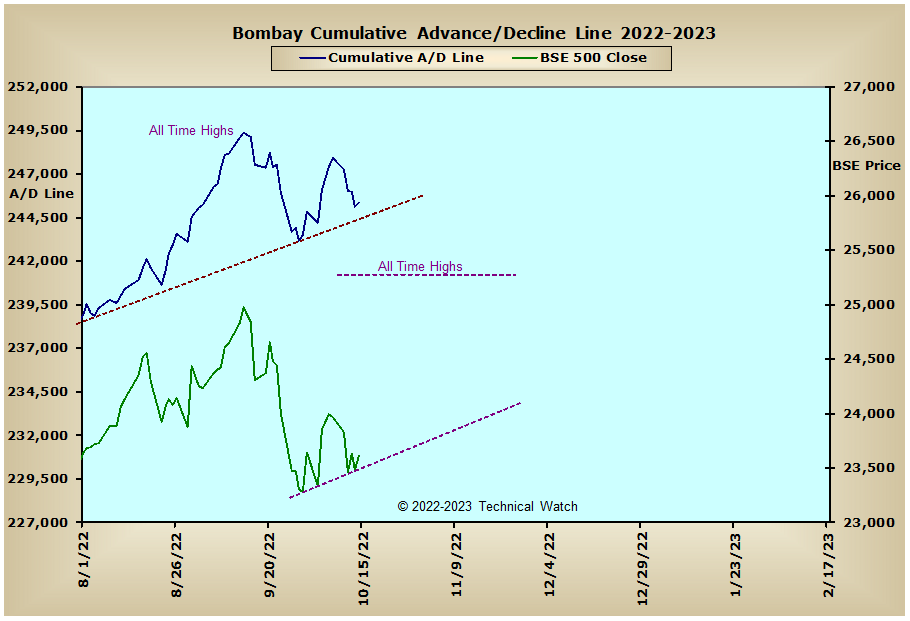
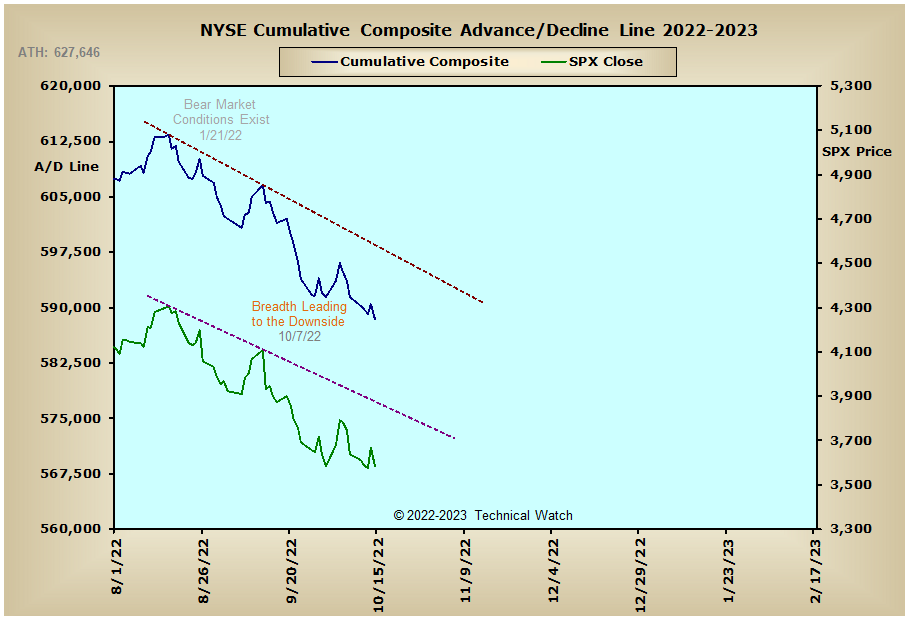
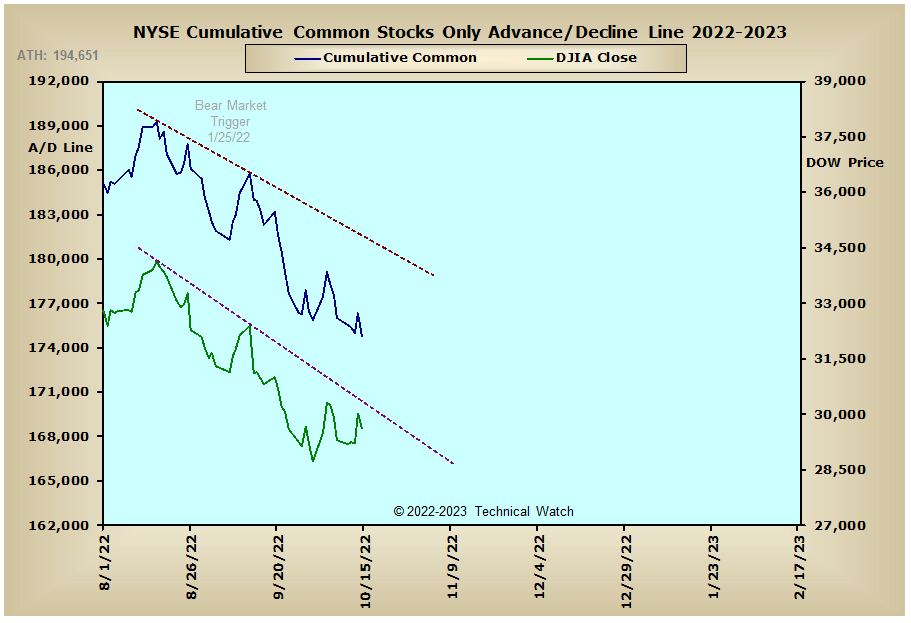
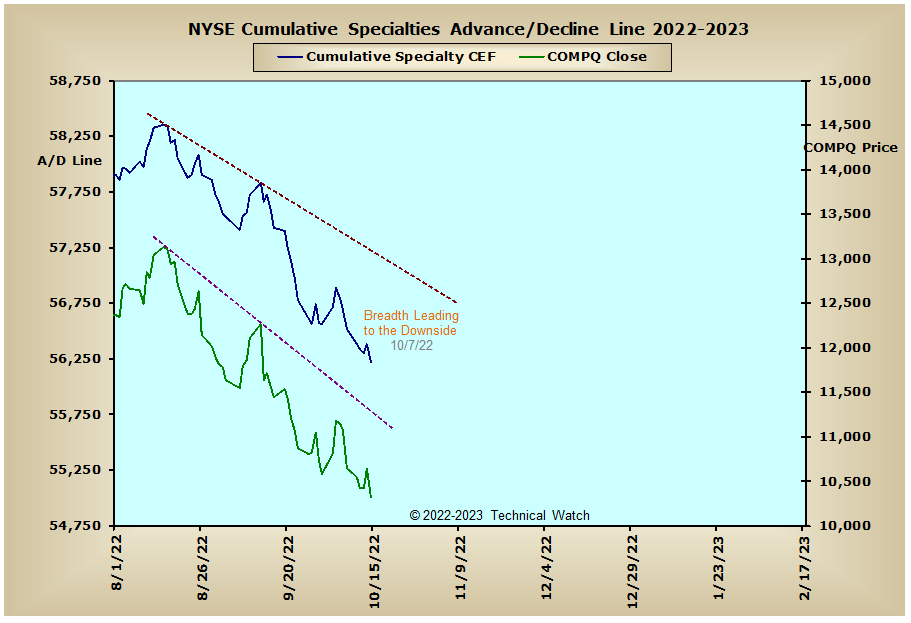
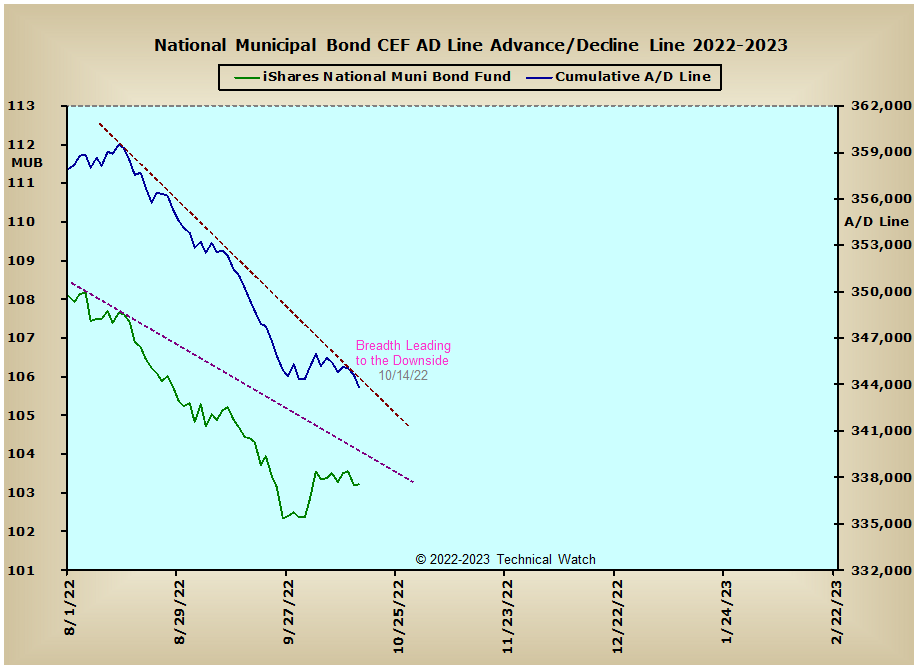
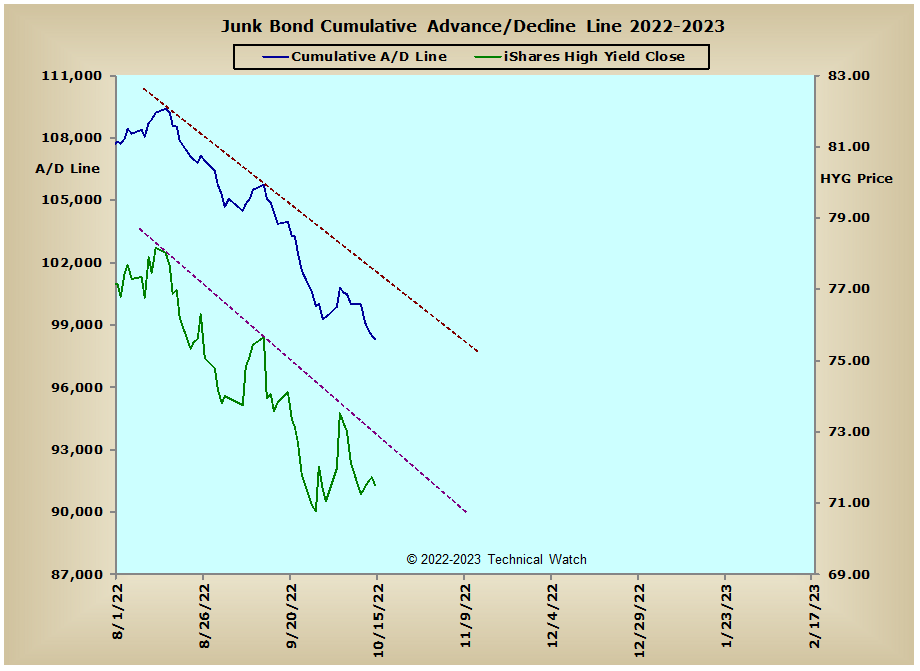
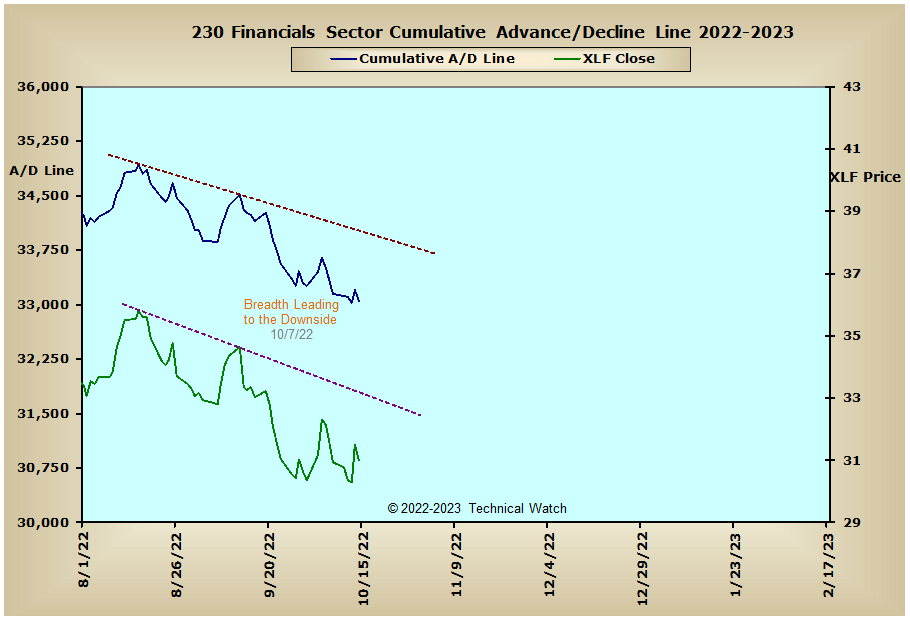
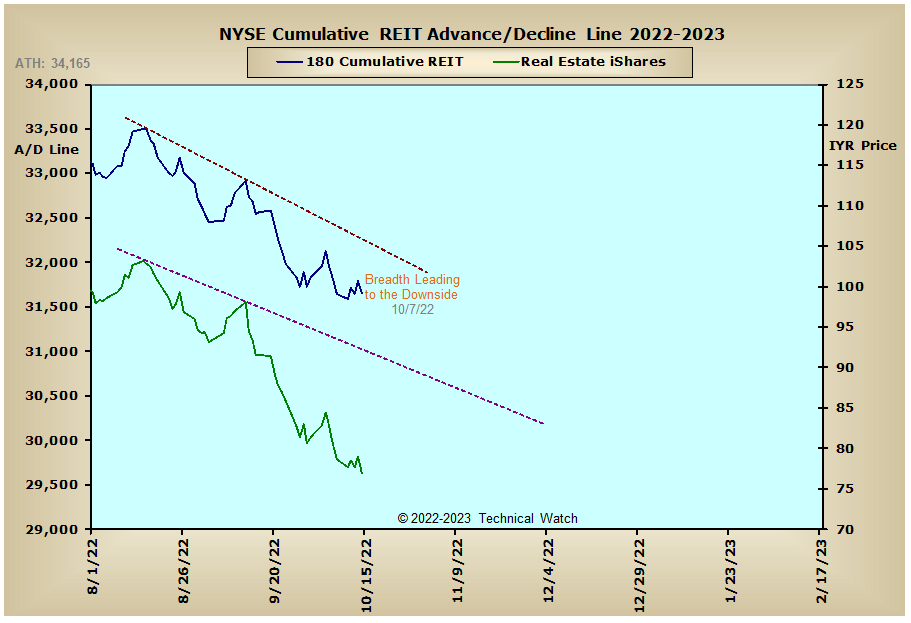
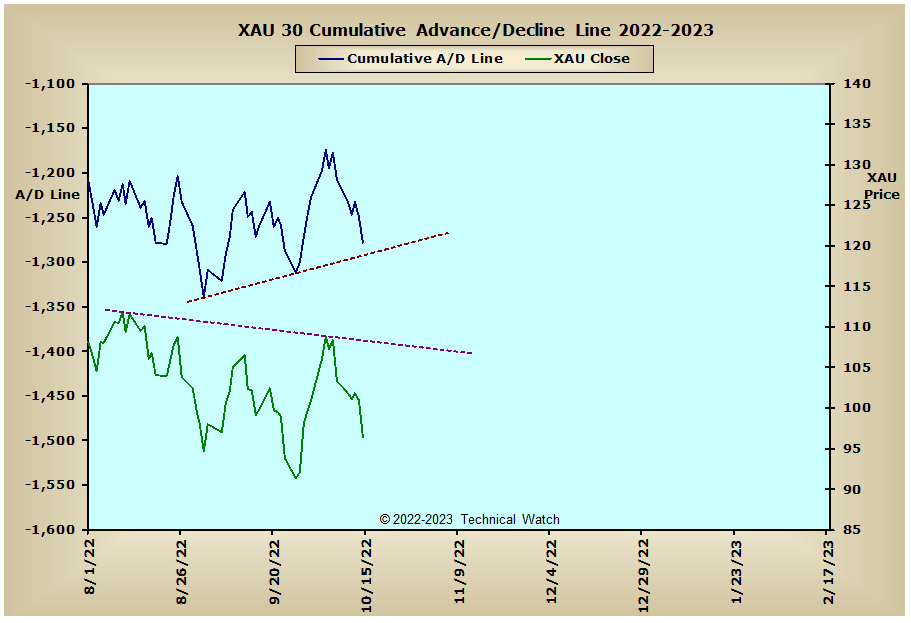
Looking at this weeks edition of our standard array of cumulative breadth charts shows very little in the way of analytical changes from the week before. Interest rate sensitive issues, in particular, continue to trend sharply to the downside as the expectation of still higher interest rates remains the biggest problem for future domestic and global economic growth. Higher interest rates, of course, continue to be a negative harbinger for the precious metals arena as the price of gold and silver are now at their lowest levels since the spring of 2020 on a daily, weekly and monthly basis. The energy sector is also showing breadth non confirmation of the recent rise in the price of West Texas Intermediate Crude Oil earlier this month as it's now drifting lower after finding strong resistance at its 200 day EMA. All in all, the larger trend for the financial markets remains lower at this time as the enormous liquidity pool from the start of this year continues to drain to expose its uneven bottom.
So with the BETS staying stubbornly in sell territory with a reading of -75, traders and investors continue to work with a hostile marketplace. As we begin the week ahead, we see that all of the breadth and volume McClellan Oscillators finished on Friday in negative territory with many finding zero line resistance after Thursday's session. On an intermediate term basis, we also see that all of the breadth and volume McClellan Summation Indexes remain in negative territory as well with many now considered deeply "oversold" near or below their -1000 levels. Under such conditions, our ongoing idea of a potential crash sequence is now becoming less likely as opposed to a marketplace that will just continue to trend lower as we go into the month of November. Moving into this months OPEX period that's coming up on Friday, the 10 day running average of the CBOE and Equity put/call ratios continues to show speculative call buying at this time which is not indicative of a marketplace that is nearing of a tradable bottom. That said, the NYSE and NASDAQ Open 10 TRIN's both finished on Friday in "oversold" territory with readings of 1.11, and this may allow for a near term boost for prices to start things off on Monday. With all these bread crumbs as a guide then, let's again continue to walk the bearish path of least resistance for the week ahead, while maintaining our trading disciplines on entry and exit points.
Have a great trading week!
US Interest Rates: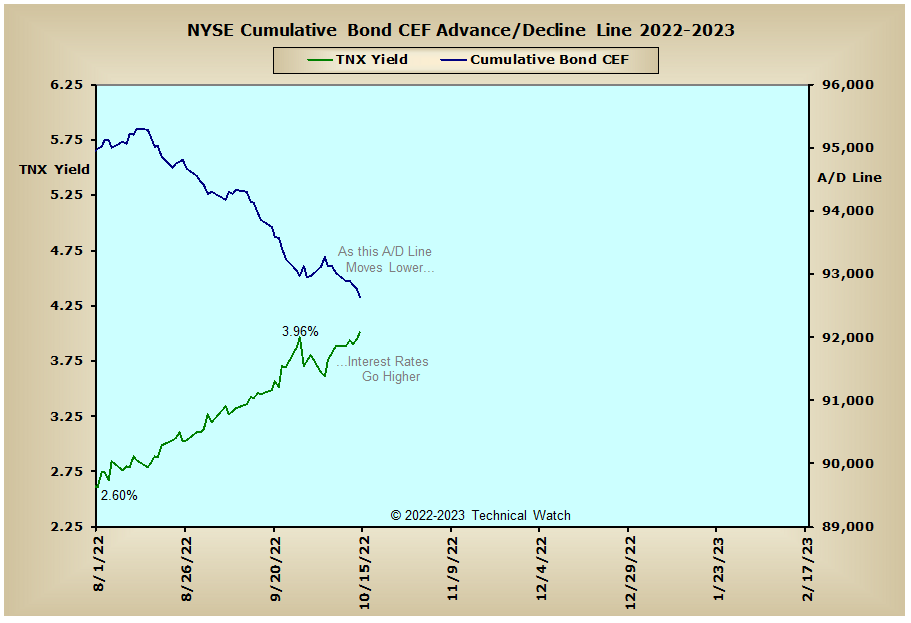
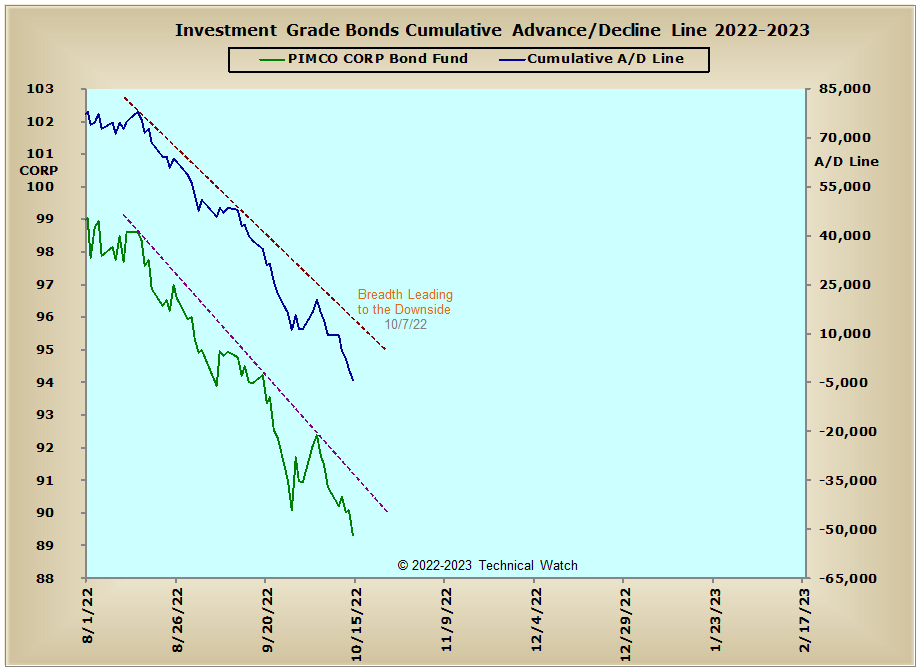
US Sectors: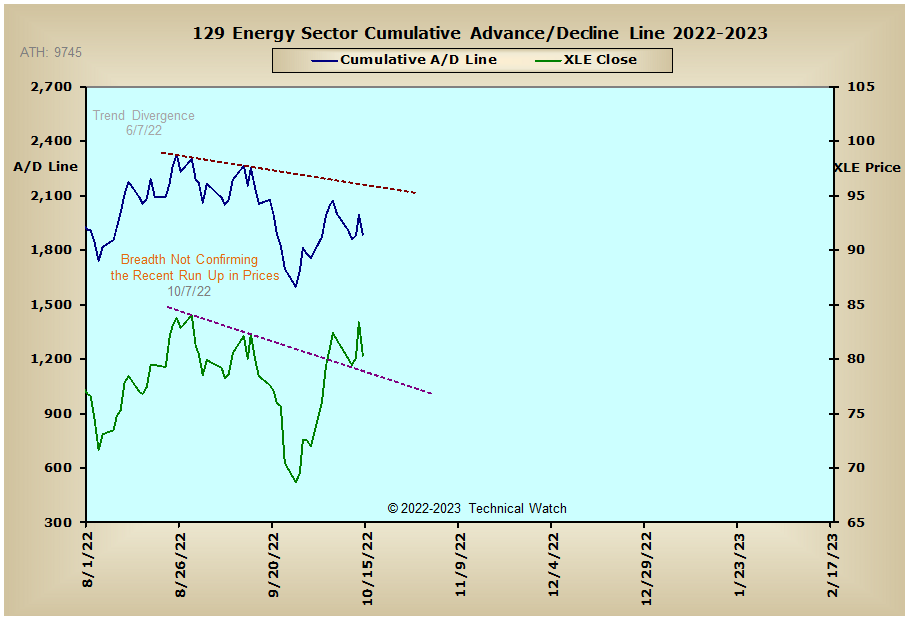
Precious Metals: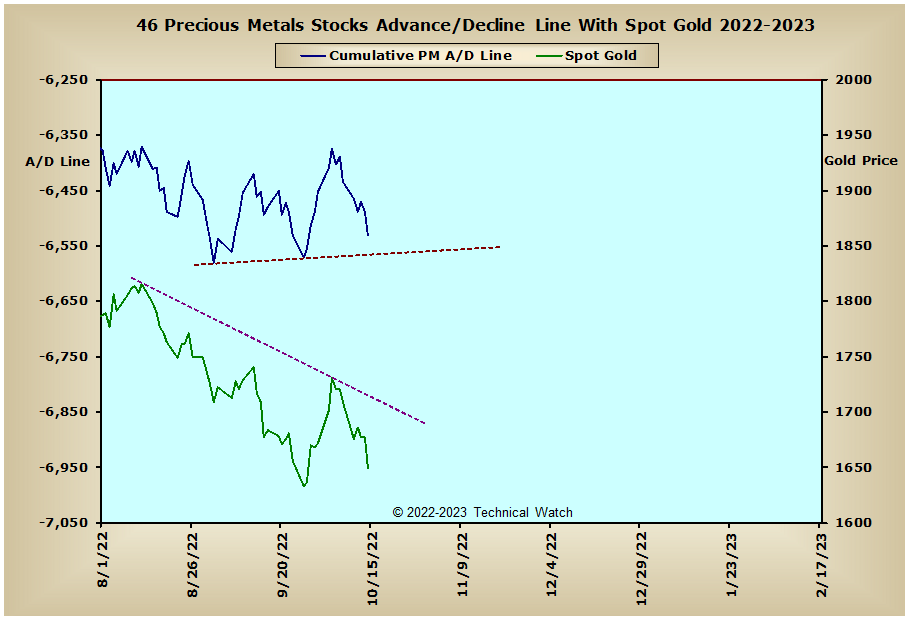
Australia: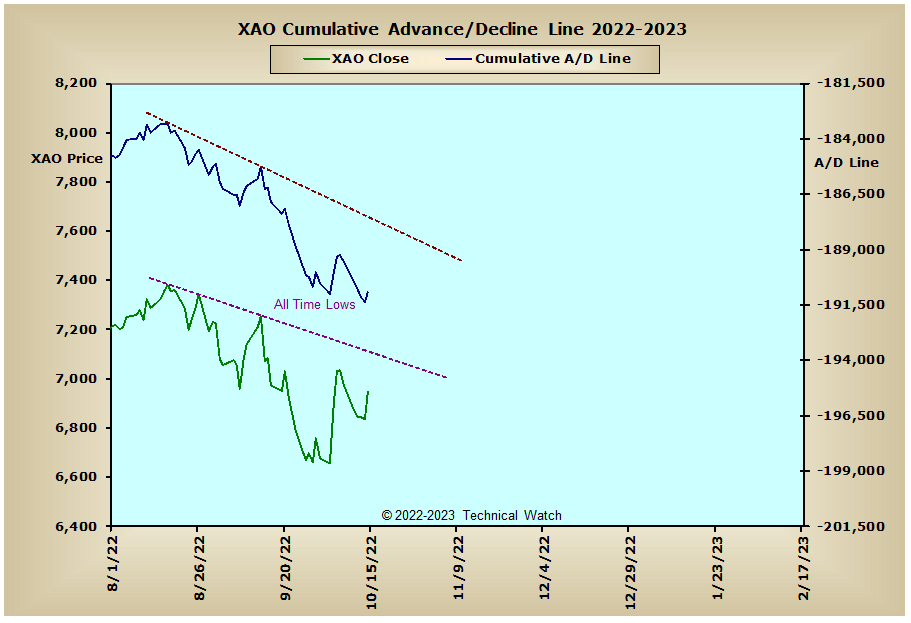
England: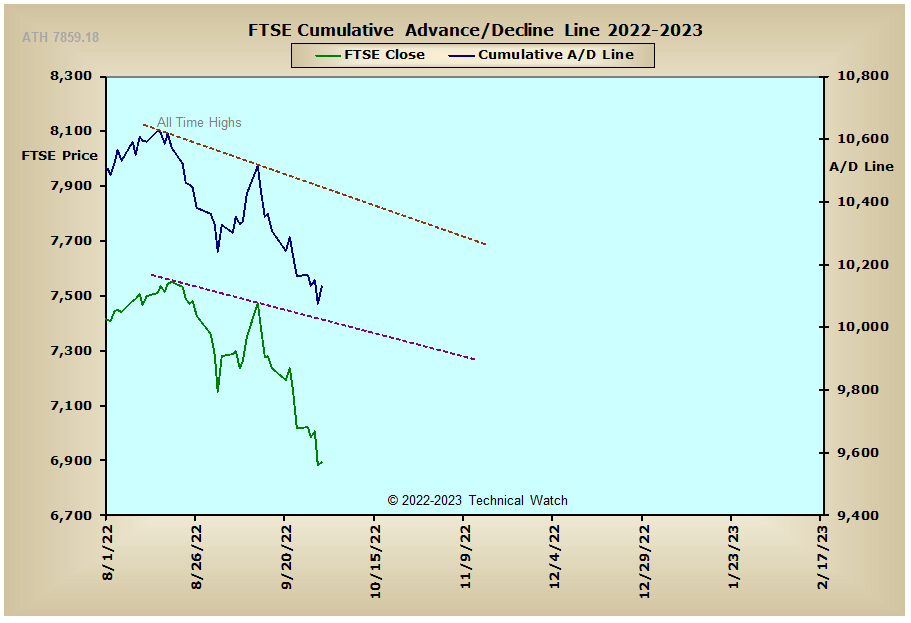
France: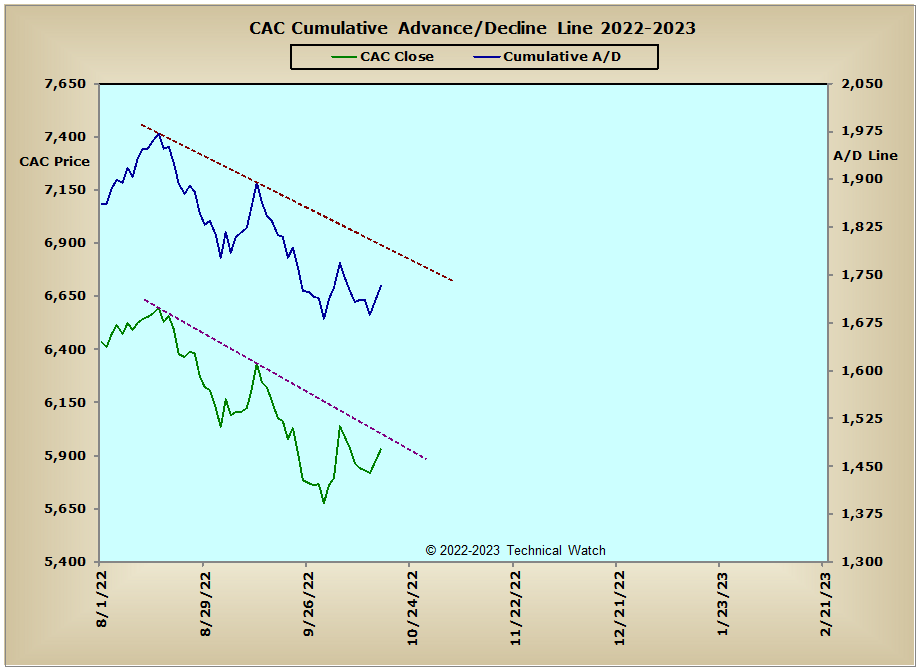
Germany: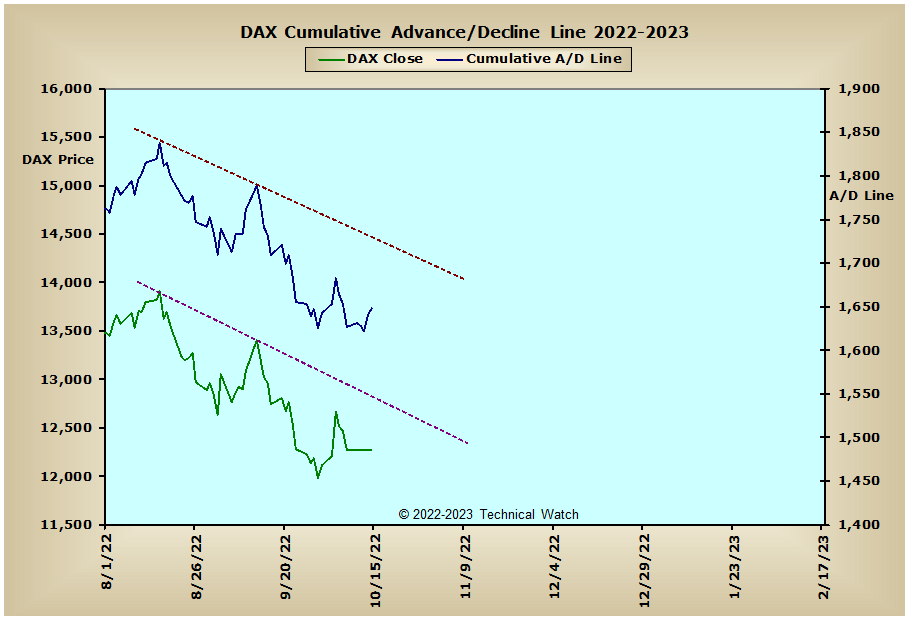
India: