buy too much, migh have one last shove in it, (JMHO
Posted 21 October 2022 - 09:38 AM
Posted 21 October 2022 - 11:43 AM

Posted 21 October 2022 - 11:50 AM

Posted 22 October 2022 - 12:51 PM
This my way of holding on to my $TNX Fearless Forecast about rates peaking. I see Gundlach is getting the same idea basically.
Edited by slupert, 22 October 2022 - 12:52 PM.
Posted 24 October 2022 - 01:22 PM
Chili, I just want to tell you that I have always appreciated your informative charts over the years!
While opinions may be a dime a dozen...I like seeing a roadmap.
Posted 25 October 2022 - 11:19 AM
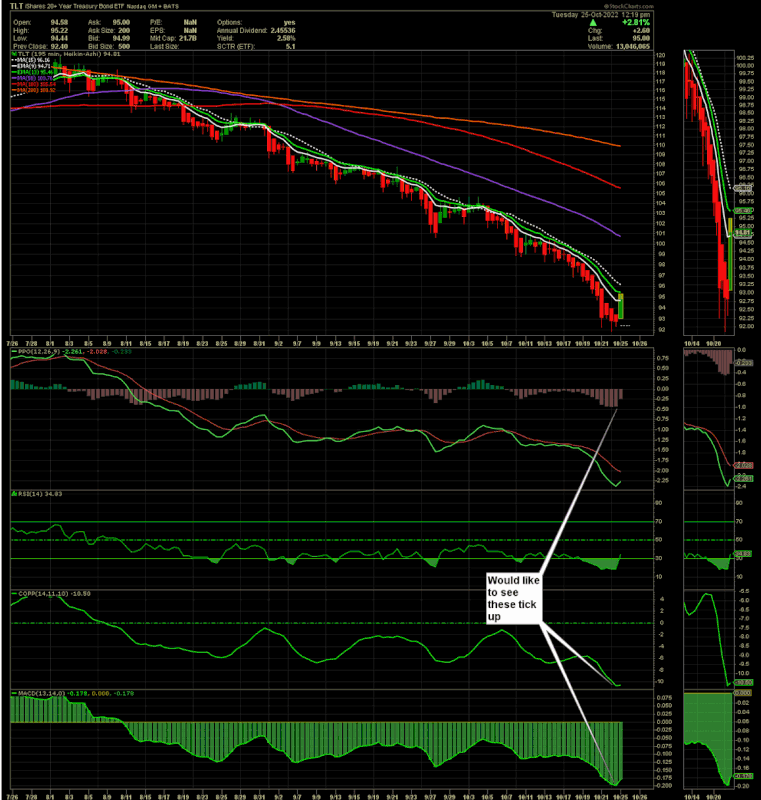
Happy today! TLT @ 95 Looks like a little island was made at the bottom! (195 minute chart)
Edited by Rogerdodger, 25 October 2022 - 12:03 PM.
Posted 25 October 2022 - 11:22 AM
I trade the two and four hours charts. And there she goes:

Posted 27 October 2022 - 01:30 PM
Nice trade on this one.
Did you bail when your stuff (PPO,COPP & MACD) turned down today?
(Just wondering if you might use other tricks like trendlines, support, fib, etc. to exit.)
Nosy, ain't I!
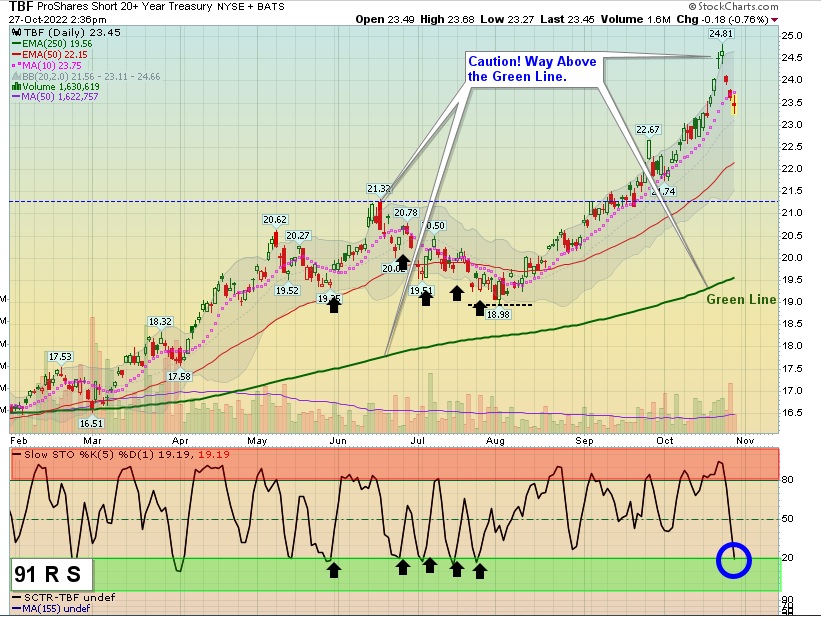
PS: TBF - Inverse Long Term Treasury Bonds today looks like the opposite of TLT on Oct. 25th
Fast MACD has turned up.
From Joanne Klein's Above the Green Line #1 at Stockcharts:

Edited by Rogerdodger, 27 October 2022 - 01:49 PM.
Posted 27 October 2022 - 04:00 PM
Roger , feel free to ask anytime. Remember, I trade longer "swing" setups on the two and 4 hour charts. However, when the FED signals a change I may go long TLT with a big chunk of assets. They already signaled thru the WSJ last week that they may modify their raising rates. That's why the stock market and TLT rallied last week.
Umm, that should say PPO in the charts. They both are similar indicators.


Edited by Chilidawgz, 27 October 2022 - 04:06 PM.
Posted 27 October 2022 - 06:20 PM

TTHQ Directory →
Fearless Forecasters →
TLT, steady in front of the big dayStarted by slupert , 29 Apr 2022 |
|
|
||
TTHQ Directory →
Fearless Forecasters →
DOJI, Da bottom?Started by slupert , 20 Apr 2022 |
|

|