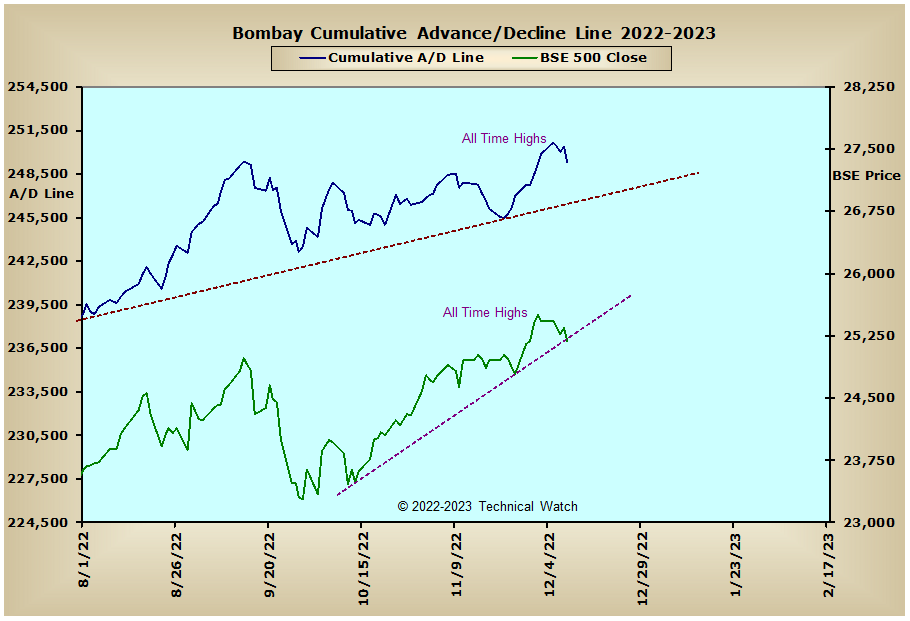
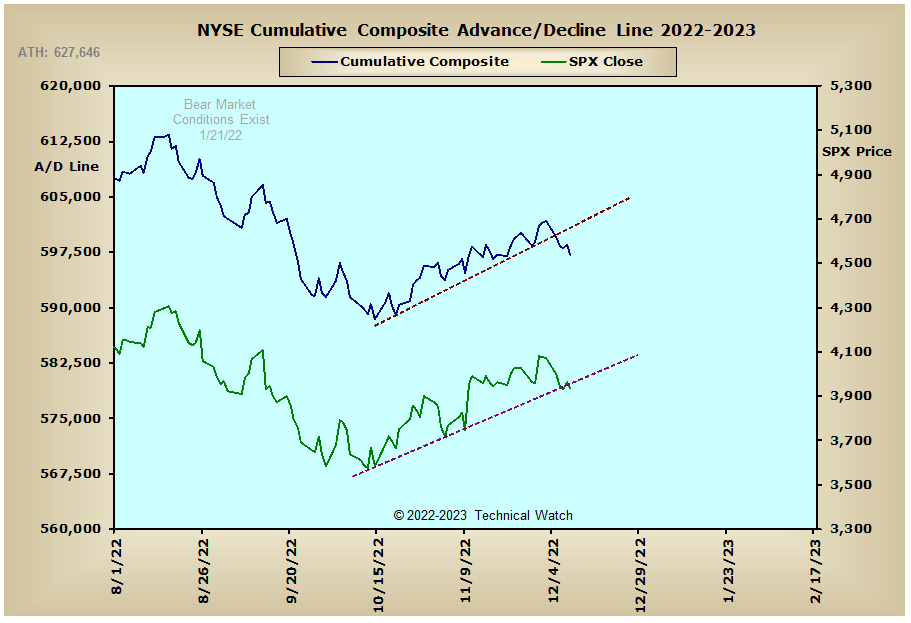
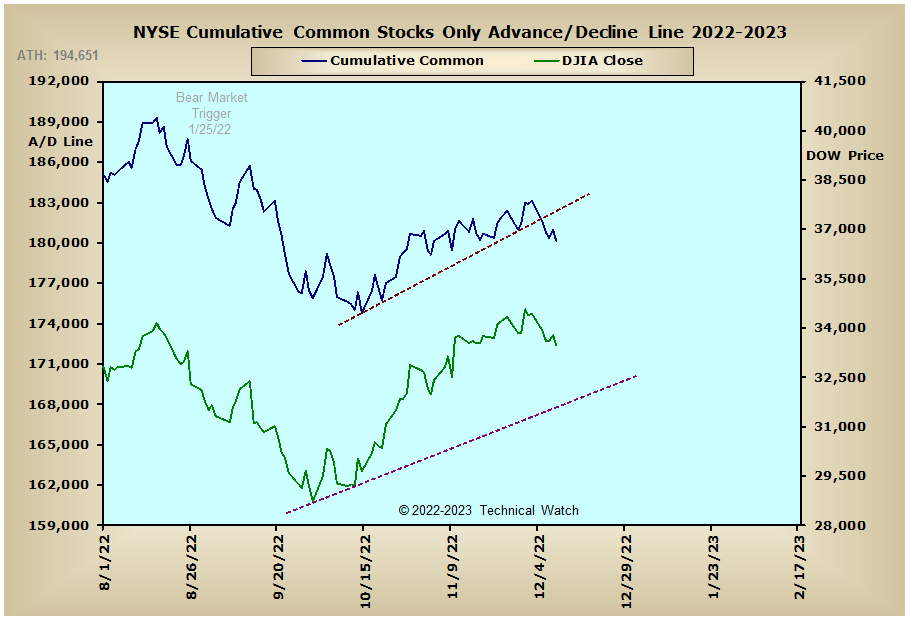
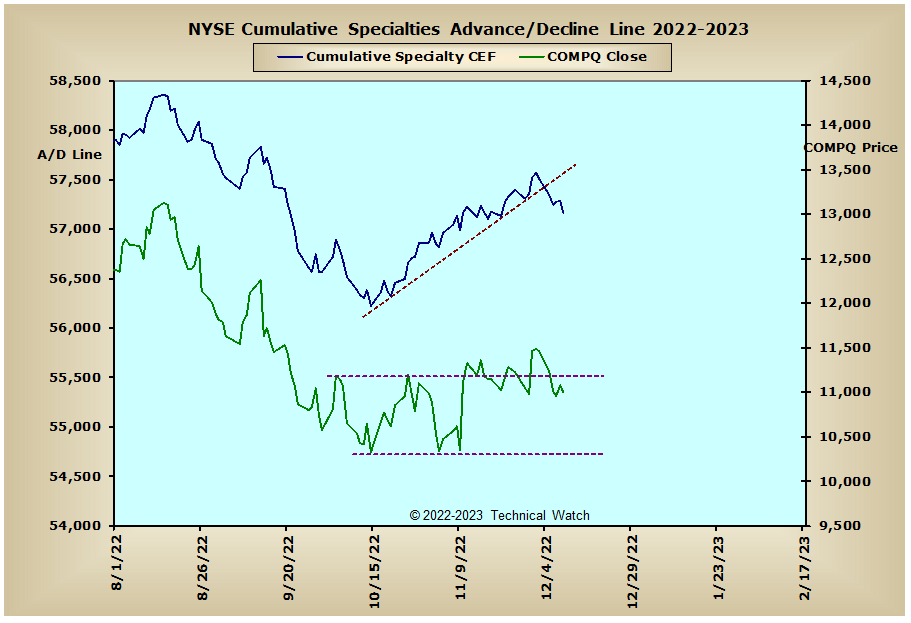
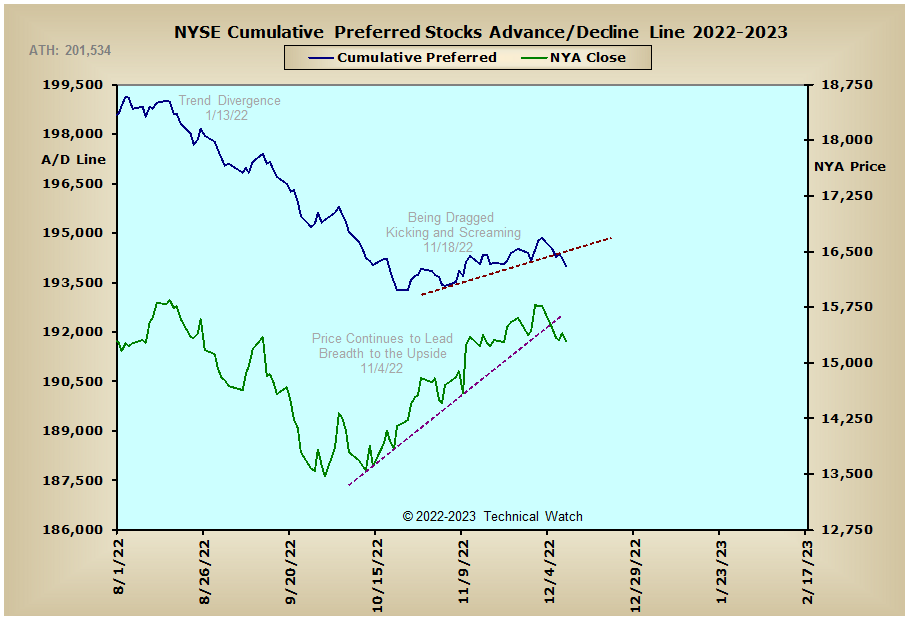
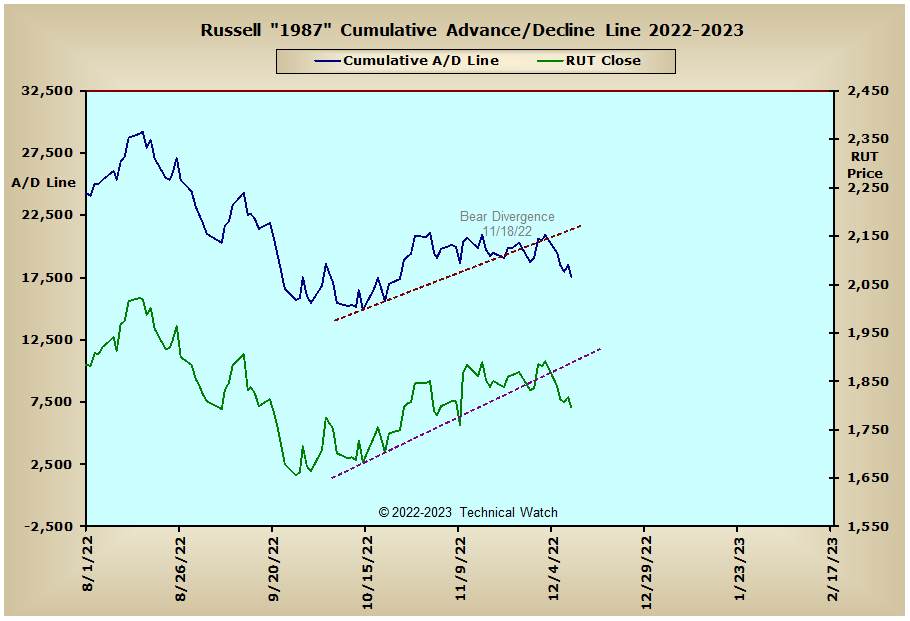
The major market indices fell out of bed to start the week on Monday, and then laid on the floor trying to recover for the rest of the week. With Friday's PPI numbers giving traders more to think about, indexes then closed near their lows of the week with an average loss of -3.66%, with the S&P 600 Small Cap Index the weakest link as it finished lower by -4.72%.
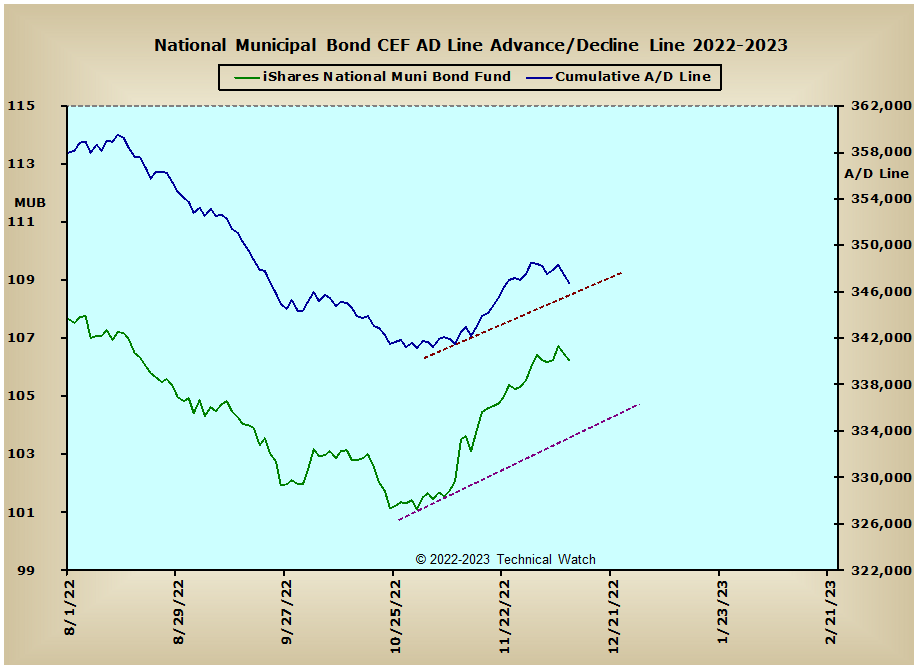
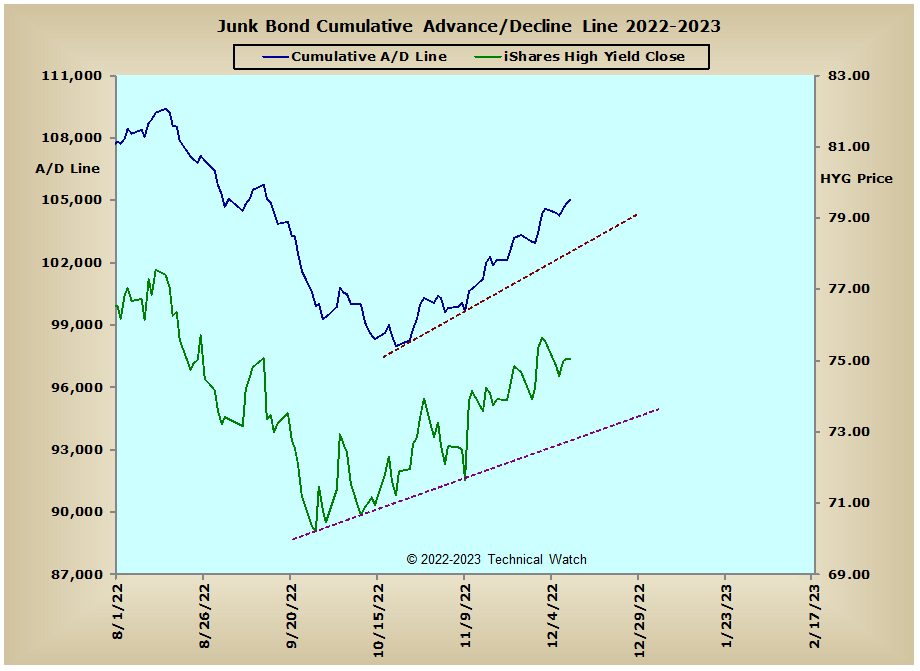
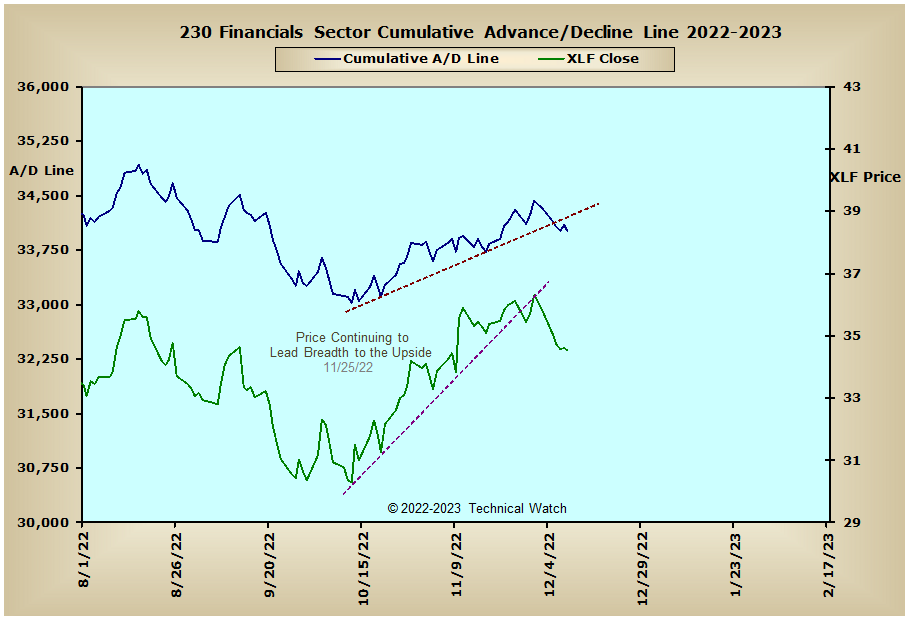
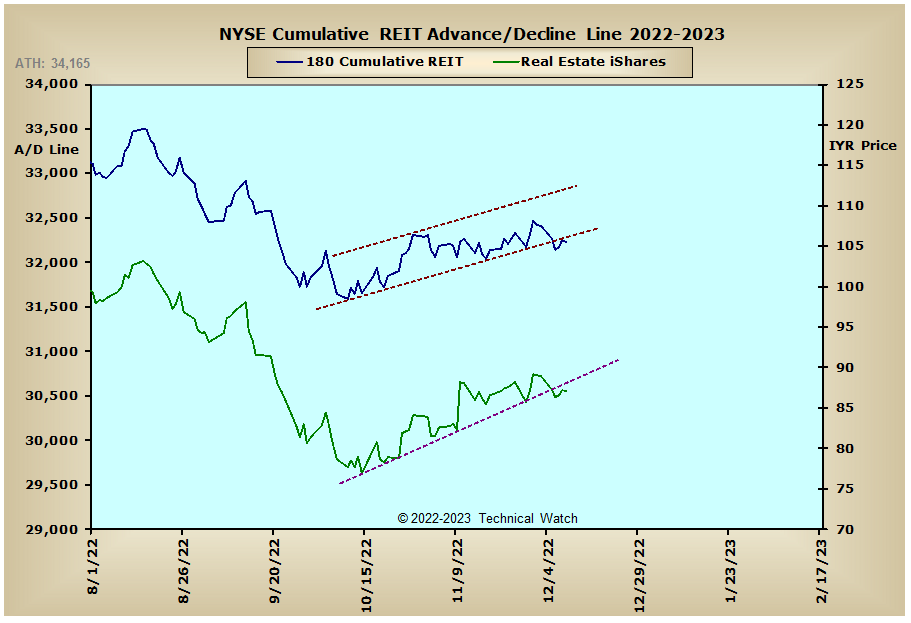
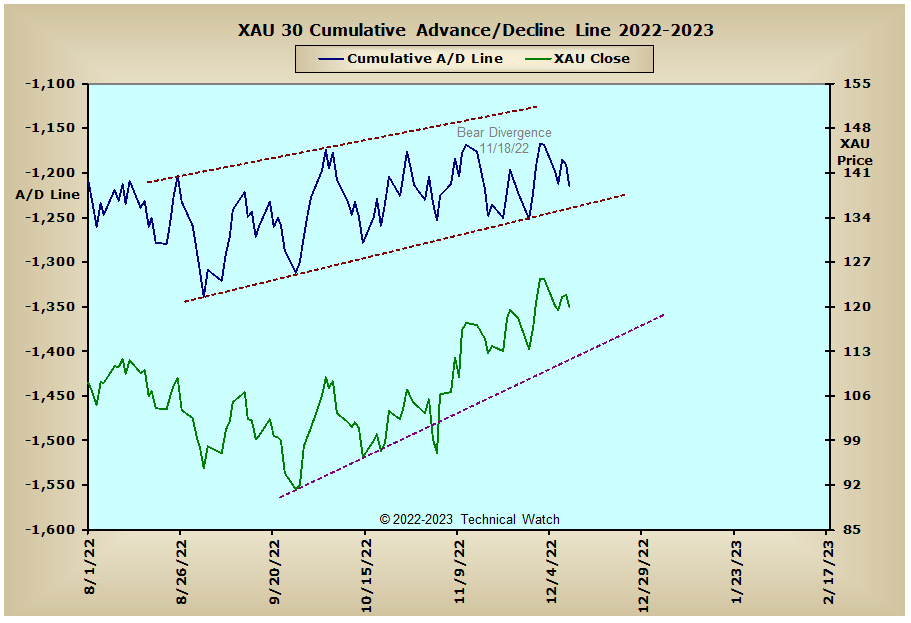
A cursory view of our standard array of cumulative breadth charts shows that we had trendline breaks across a wide front last week with the exception of the interest rate sensitive issues that continue to trend to the upside. Particular weakness is noted in the Energy Sector advance/decline line where it finished at its lowest levels since mid October as the price of West Texas Intermediate Crude oil fell last week by -11.20%. This suggested economic weakness is providing fuel for interest rate crowd as the yield of the 10 year note finished on Friday at its lowest levels since mid September at 3.57%. This, of course, should eventually be good news for the precious metals asset class as liquidity levels begin to rise again, but at this juncture, traders remain rather indifferent on gold and silver stocks as their A/D lines continue to show a real lack of bullish conviction. Finally, the CAC, DAX and FTSE advance/decline lines all show a top beneath a top working currently which could be a harbinger of things to come as we begin 2023.
So with the BETS getting slammed to its lowest levels since October 21st at -60, investors are now back to being in a fully defensive posture toward equities. All of the breadth and volume McClellan Oscillators start the week in negative territory with many of the breadth MCO's making lower lows on Friday without the volume MCO's confirming this same weakness. This, along with the short (MCO) and intermediate (MCSUM) term trends of breadth and volume on either side of their respected zero lines, would suggest that prices are likely to trade within a corrective sequence, in the form of either a trading range or symmetrical triangle, as we juggle with November CPI on Tuesday, the FED Statement on Wednesday, and the final OPEX event of the year to finish off the week. Weakness continues to be most prominent in the NASDAQ marketplace as the NDX breadth MCSUM moved down and through its zero line on Friday to join the broader exchange in negative territory. Renewed weakness is also noted in both the MID and SML basket of issues as well with the great majority of growth stocks well below their 200 day EMA's of bear market resistance. On a more positive note for the buyers, both the NYSE (1.11) and NASDAQ (1.02) Open 10 TRIN's remained in "oversold" territory on Friday, while the 10 day average of both the CBOE and equity put/call ratios continue to show a trend of speculative put buying at this time and adding further buoyancy. Mixing everything together then, we should continue to see choppy, if not volatile, market behavior as we finish out the year in what is now beginning to look like a weak January period. With all this in mind then, investors can now begin to benefit from their observances of sector rotation by moving selectively short those areas that have continued to show weakness over the last over the last month, while traders maintain their "hit and run" strategies in what should be a great week ahead of scalping and day trading.
Have a great trading week!
US Interest Rates: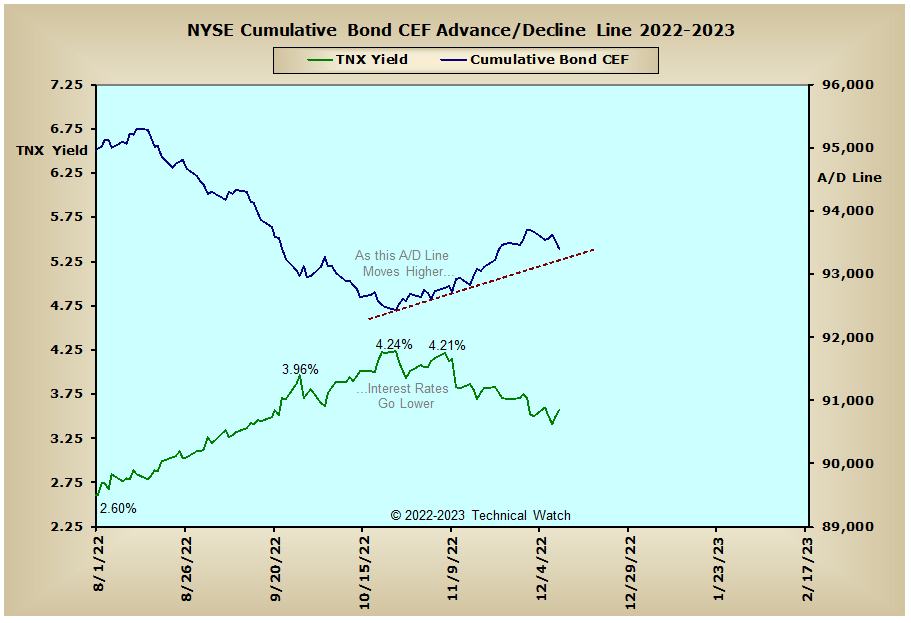
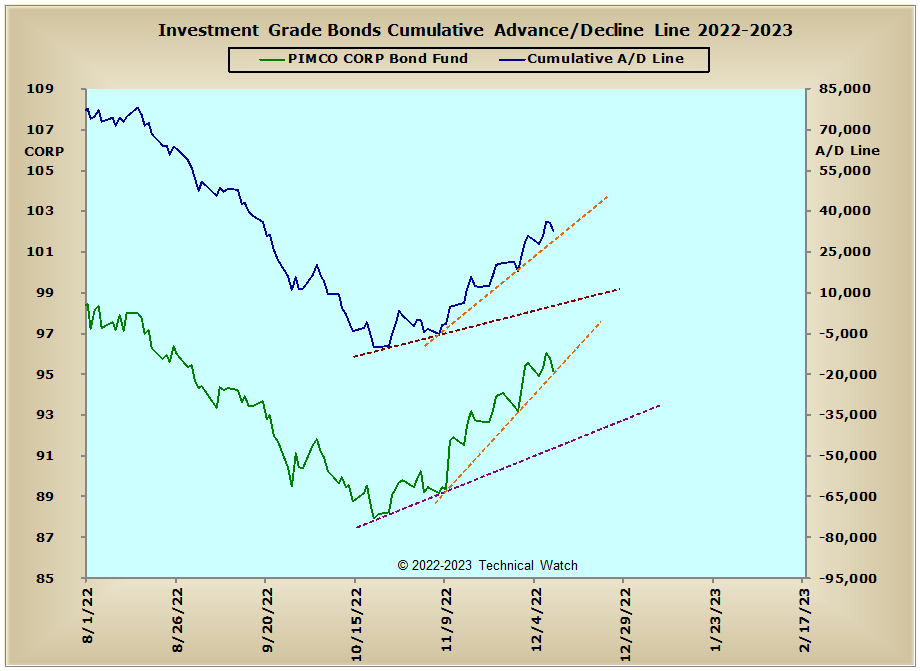
US Sectors: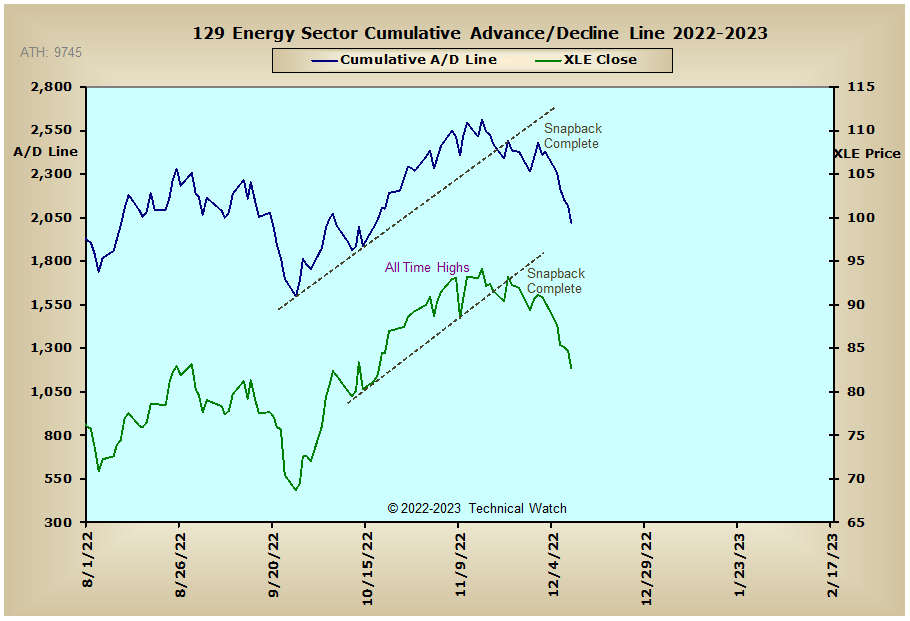
Precious Metals: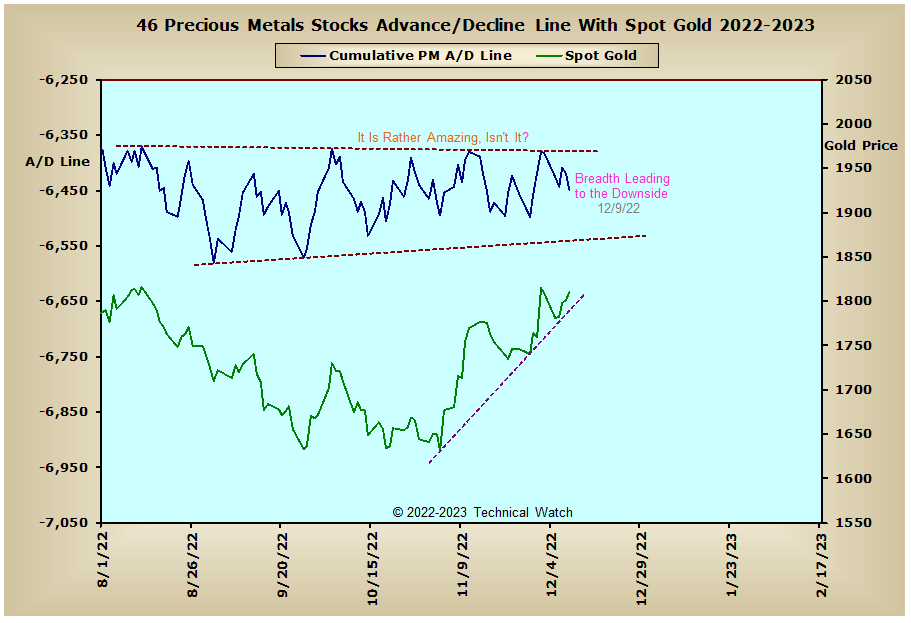
Australia: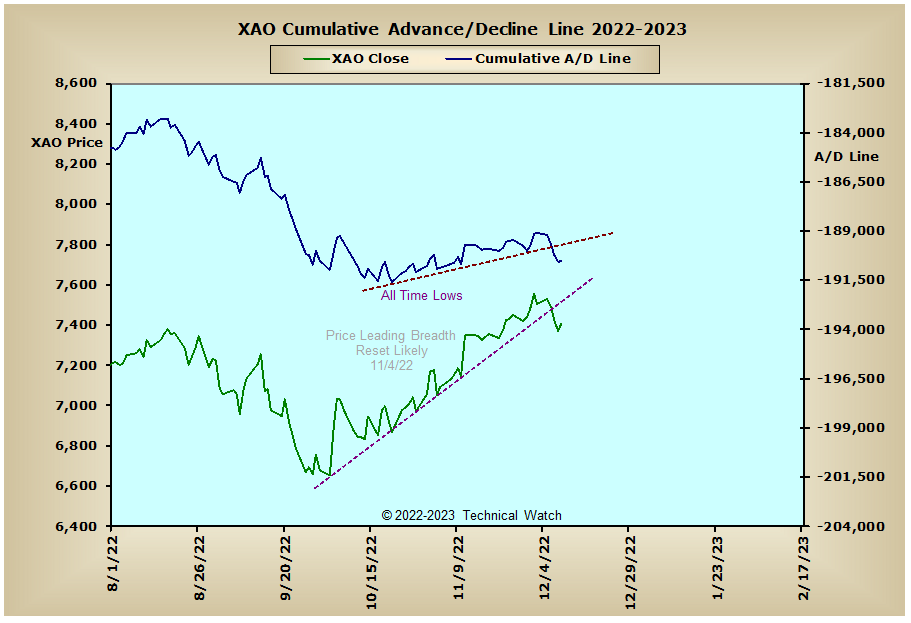
England:
France: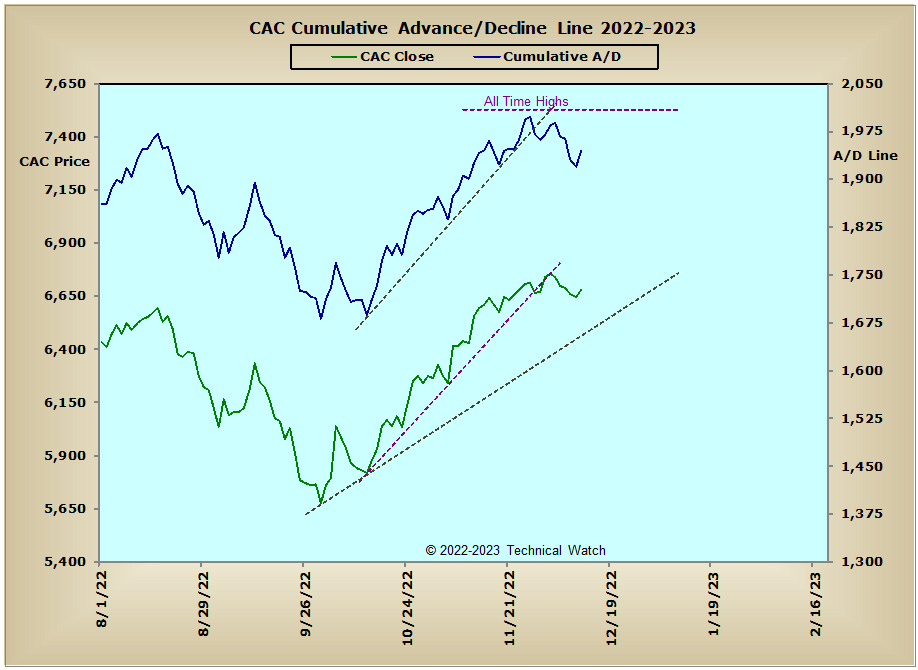
Germany: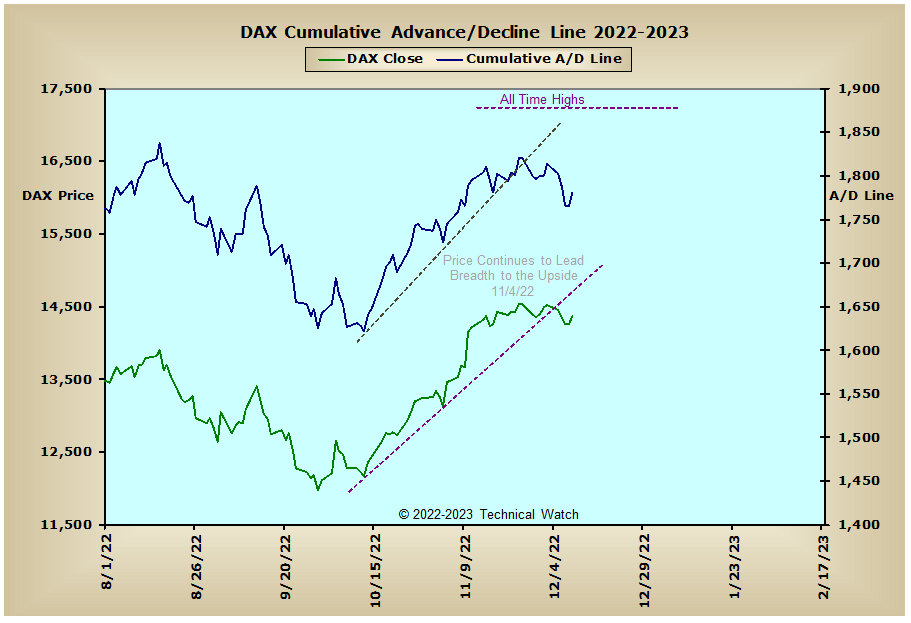
India: