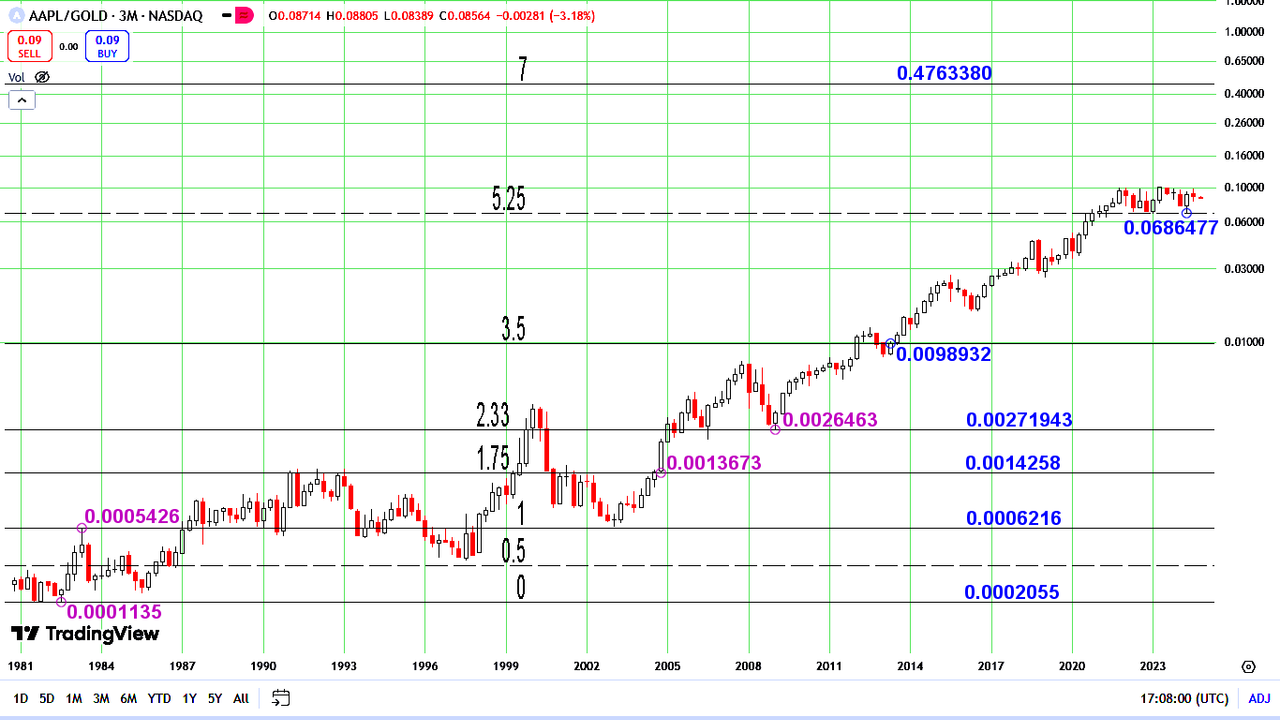
Tradingview log charting appears to exhibit unreliable behavior over extreme ranges - presenting as distortion (at the lower end of the scale?). Here's a chart of aapl/gold with the scale derived from the 5.25 and 3.5 levels.

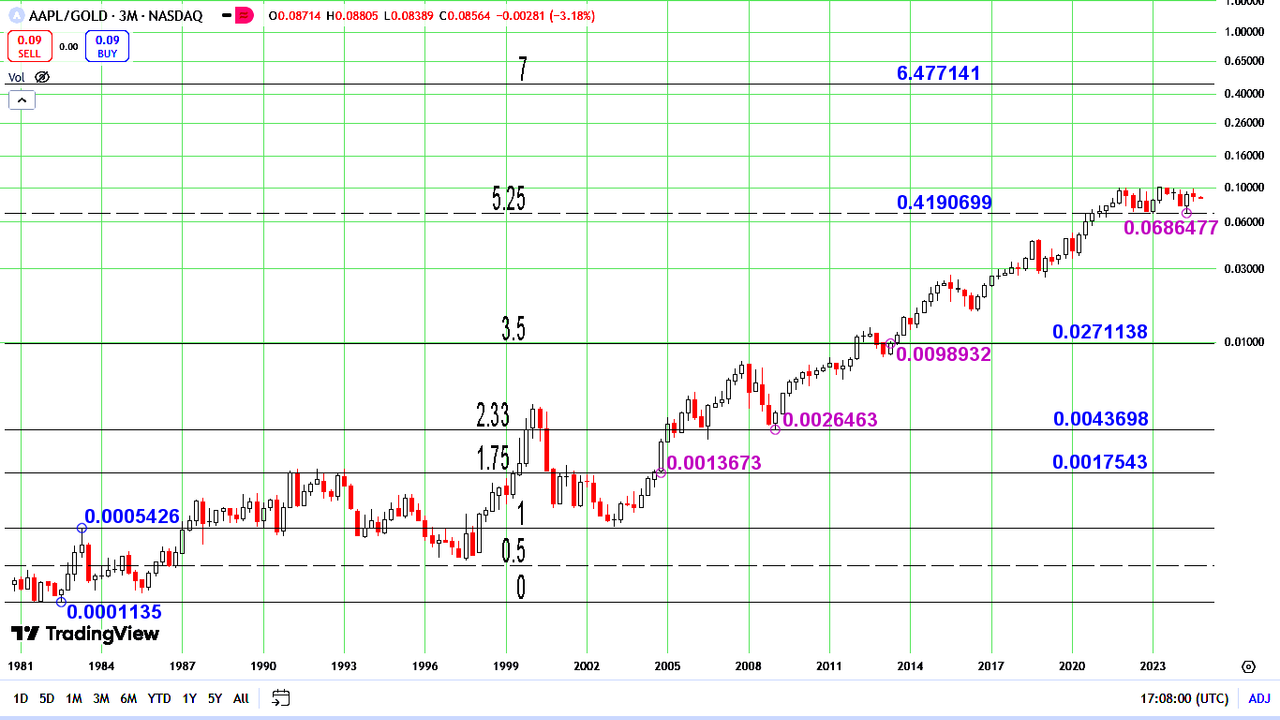
Here's the same chart with the scale derived from the lower two levels.

Assuming my math is correct, this is surprising and nontrivial, because trend lines depend on proper chart scaling.


